They fail when sources, logic, and design aren’t aligned.
I’m Lukas Reese, a Power BI Developer & Consultant based in Germany (Hannover), working worldwide remote. I help teams turn messy data into fast, trusted dashboards that drive actions.
Based in Germany (Hannover). Remote delivery across Germany and worldwide.
You’re a strong match if you have at least one of these problems:
- ✓You have data, but no clear reporting structure or dashboard standard
- ✓Power BI models are slow, fragile, or hard to extend
- ✓Stakeholders argue about layout, spacing, and “optics” instead of insights
- ✓Multiple sources and nobody owns KPI definitions end-to-end
Services
End-to-end Power BI consulting, optimization, redesign, Zebra BI (IBCS visuals), and training — built to be scalable, documented, and actionable.
End-to-End Power BI Consulting
From “we have data” to a complete reporting system that people trust and use.
- Business questions → dashboard outputs
- Semantic model + scalable foundation
- Documentation + handover
Power BI Optimization
Make slow reports fast and fragile models stable.
- Performance audit + quick wins
- DAX & model refactoring
- Refresh reliability + maintainability
Power BI Report Redesign
Professional dashboards so feedback shifts from optics to decisions.
- Layout system + information hierarchy
- Reusable standards + templates
- Higher adoption across teams
Data Model & Backend Optimization
Fix the foundation under Power BI so it stays clean and scalable.
- Semantic modeling + relationships
- Validation + data quality approach
- Scalable patterns for growth
IBCS Visuals (Zebra BI)
Executive-ready reporting standards that improve trust and decisions.
- IBCS structure + layout standards
- Zebra BI setup + best practices
- Storytelling for actions
Power BI Training
Train your team to own reporting without depending on one person.
- DAX, modeling, performance
- Report design best practices
- Governance basics for teams
Selected work
Real examples from my portfolio.
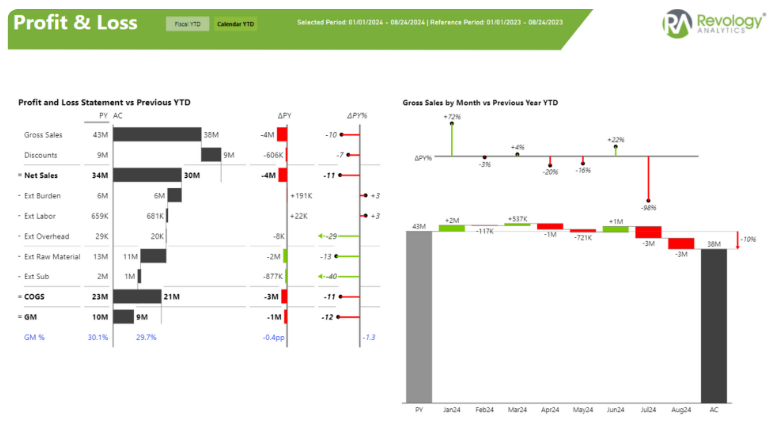
Sales dashboard that drives growth
Decision-ready KPIs and a clean layout system for sales performance.

Google Search Console dashboard in Power BI
SEO analysis with a workflow-like UX and consistent KPI logic.
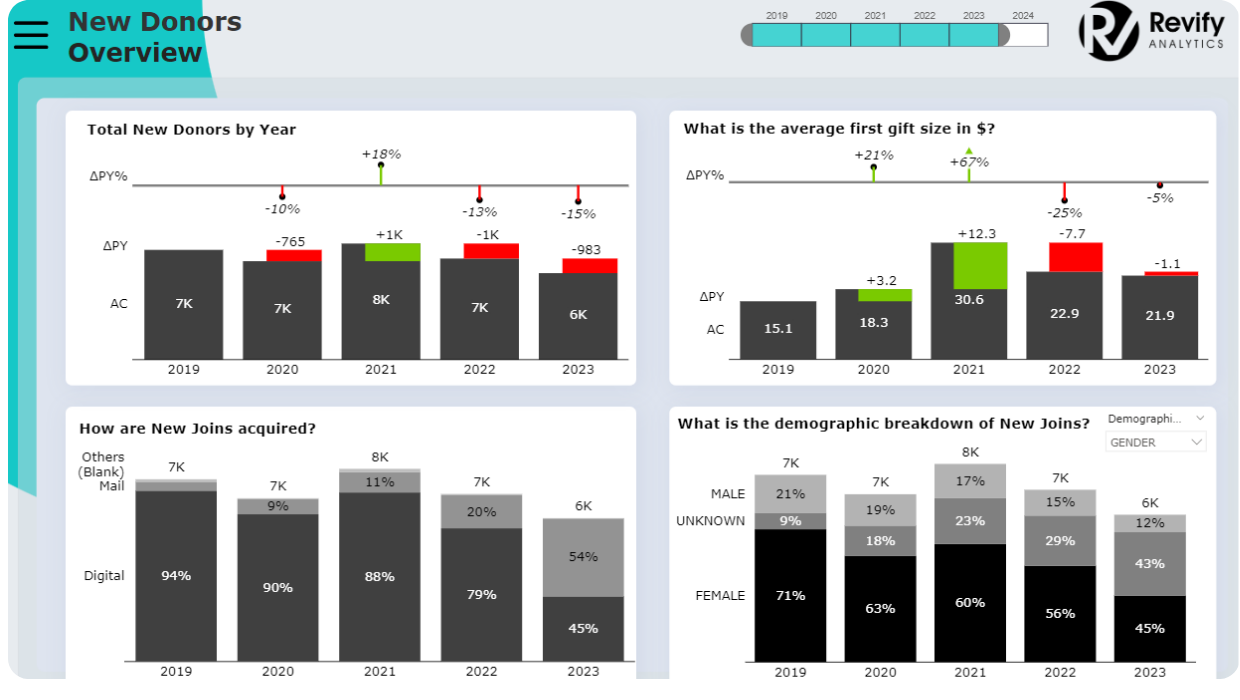
Non-profit donor analysis dashboard
Segmentation and insights for retention, campaigns, and donor behavior.
Power BI Background Designer
Generate pixel-perfect report layouts with consistent spacing. Header, sidebar, KPI cards, visuals — aligned automatically.
- ✓Pixel-perfect alignment (header, sidebar, KPI row, visual grid)
- ✓Consistent spacing across pages and projects
- ✓Export-ready backgrounds for your Power BI workflow
No mock data. Just pixel-perfect backgrounds for Power BI.
How we work
A practical process that keeps projects focused on outcomes: clear questions, clean foundations, and dashboards that drive actions.
?
How do we start a Power BI project from scratch?
+
How do we start a Power BI project from scratch?
We start with outcomes, not tools. I ask the questions that clarify what your business actually needs: what decisions should the dashboard support, which KPIs matter, who uses it, and how often. Then we define the outputs so there’s a clean target before any modeling starts.
?
What happens in the first deep dive / as-is analysis?
+
What happens in the first deep dive / as-is analysis?
I review your current environment: data sources, reporting pain points, existing Power BI content (if any), KPI definitions, and constraints (security, refresh, ownership). The goal is to identify the best-fit approach to automate your reporting—without building the wrong thing.
?
How do we build the solution together?
+
How do we build the solution together?
Delivery depends on your sources and tooling, but the structure stays consistent: truth layer first (definitions + model), then visuals built around actions. You’ll see progress early, and we iterate fast—so you don’t wait weeks for a “big reveal.”
?
What will you deliver at the end?
+
What will you deliver at the end?
A documented reporting solution: a clean semantic model, reusable patterns, performance-ready measures, and dashboards that look professional and stay maintainable. If needed, I include short training so your team can own it.
?
How much does a Power BI project cost?
+
How much does a Power BI project cost?
It depends on scope, number of sources, and what “done” means for your team. Book a short call or send a message—I'll ask a few focused questions and then give you a clear reference range and options.
Want your dashboards to be trusted and used?
Tell me what’s messy (sources, KPIs, performance, design). I’ll respond with clear next steps and what I’d change first.
- Clear assessment + next steps
- Scope and timeline clarity
- A plan your team can execute
Latest posts
On my blog, I share insights gained from real-world experiences, dive into common challenges, and explore interesting use cases in the world of Power BI and data analytics. Whether it's best practices, problem-solving techniques, or tips for enhancing your analytics projects, my goal is to offer valuable knowledge that can help both beginners and seasoned professionals. Follow along for practical advice, creative solutions, and deep dives into the ever-evolving landscape of data.