Creating a dynamic Date Table in Power BI is an essential skill for any Power BI Developer. This blog post will guide you through the steps to create a dynamic Date Table in Power BI. This ensures that your data models are efficient, flexible, and up to date.
Definition of a Date Table
A Date Table in Power BI is a specialized table that contains a series of dates and their associated attributes. This includes days, weeks, months, quarters, and years. It facilitates efficient and accurate time-based data analysis, enabling complex temporal calculations and comparisons.
In data analysis, especially within Power BI, time-based analysis is crucial. A Date Table provides a structured and consistent way to manage and analyze time-related data. It enhances the accuracy and efficiency of reports and dashboards. This article will explore the significance and application of Date Tables in Power BI.
For more details on date tables visit the learning pages of Microsoft:
Why a Dynamic Date Range?
A dynamic ending year range in your Date Table is crucial for forward-looking analysis. It means that when the current month is December, the Date Table automatically includes dates for the upcoming year. In one of my recent project, I faced a requirement to add a new year once we reached December. The aim was to look at budgeting and forecast numbers for the next year. But we only needed that in December, and not earlier.
The Advantages of a Date Table in Power BI
Consistency and Accuracy: A central Date Table in Power BI guarantees consistency across your data models, offering a uniform approach to date and time management.
Enhanced Flexibility: With a dynamic Date Table in Power BI, you are always one step ahead. The table adapts to include additional dates automatically, making it particularly useful for year-end analysis and forecasting.
Optimization of Resources: The use of a Power BI Date Tableoptimizes both calculation speed and database space, separating time attributes like year, month, and weekday from fact tables.
Implementing Dynamic Date Table in Power BI
1. The Role of DAX: Data Analysis Expressions (DAX) play a pivotal role in creating a dynamic Date Table in Power BI. It allows you to define a table that dynamically adjusts to your data’s time frame.
2. Customizing Time Periods: Tailoring the Date Table in Power BI to your specific needs is straightforward with DAX, allowing you to include various time dimensions like fiscal quarters or specific date ranges.
3. Maintaining Up-to-date Data: The dynamic nature of the Date Table in Power BI ensures that your data remains current, reducing the need for manual updates.
4. Seamless Integration with Existing Models: Incorporating a dynamic Date Table in Power BI into your existing data models enhances analysis capabilities without disrupting established workflows.
DAX Code for Dynamic Date Table in Power BI
This section will provide the necessary DAX code to create a dynamic Date Table in Power BI. The code will be designed to cater to a wide range of time-related data analysis needs, ensuring versatility and adaptability in your Power BI reports. The start of the Date Calender is set to the year 2018, which is static. In this case it was the first year with any available data. It did not make sense to have dates prior to 2018. The end however is dynamic, and either shows the end of the current or end of next year, depending which month we are at.
Steps:
1. Go to the data view on the left side of the Power BI Report
2. Click on New Table
3. Copy & paste the DAX code and adjust it if needed.
dTime =
VAR CurrentDate = TODAY()
VAR CurrentYear = YEAR(CurrentDate)
VAR CurrentMonth = MONTH(CurrentDate)
VAR EndYear = IF(CurrentMonth = 12, CurrentYear + 1, CurrentYear)
RETURN
ADDCOLUMNS (
    CALENDAR (DATE(2019, 01, 01), DATE(EndYear -1, 12, 31)),
    "Year", YEAR ( [Date] ),
    "Quarter", FORMAT ( [Date], "Q" ),
    "Month", SWITCH (
        MONTH ( [Date] ),
        1, "Jan",
        2, "Feb",
        3, "Mar",
        4, "Apr",
        5, "May",
        6, "Jun",
        7, "Jul",
        8, "Aug",
        9, "Sep",
        10, "Oct",
        11, "Nov",
        12, "Dec"
    ),
    "Week", WEEKNUM( [Date], 21),
    "YearQuarter", FORMAT ( [Date], "YYYY" ) & "/Q" & FORMAT ( [Date], "Q" ),
    "YearMonth", FORMAT ( [Date], "YYYY" ) & "/" & FORMAT ( [Date], "MM" ),
    "Day", FORMAT ( [Date], "DD/MM/YYYY" ) & " (" & SWITCH (
        WEEKDAY( [Date], 2 ),
        1, "Mon",
        2, "Tue",
        3, "Wed",
        4, "Thu",
        5, "Fri",
        6, "Sat",
        7, "Sun"
    ) & ")",
"DayAsInteger", WEEKDAY([Date], 2),
"YearWeek",  IF(WEEKNUM([Date], 21) < 5 && WEEKNUM([Date], 2) > 50, YEAR([Date]) + 1,
            IF(WEEKNUM([Date], 21) > 50 && WEEKNUM([Date], 2) < 5, YEAR([Date]) - 1, YEAR([Date]))
        ) & "/W" & FORMAT(WEEKNUM( [Date], 21), "00"),
"DateAsInteger", FORMAT ( [Date], "YYYYMMDD"),
"MonthNum", MONTH( [Date])
)
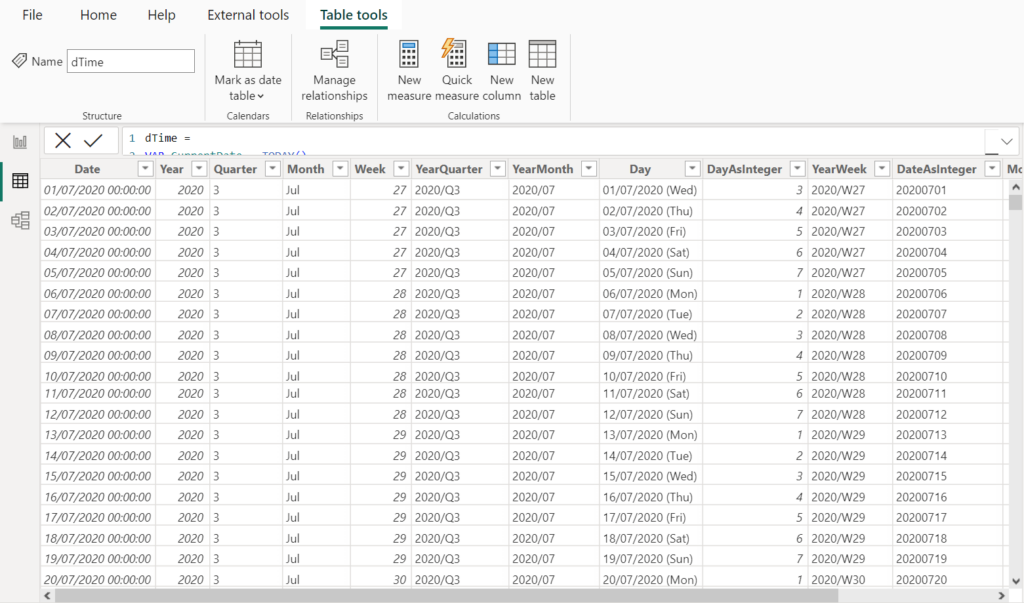
The output:
This code in Power BI is like a smart calendar that not only keeps track of dates but also organizes them into useful categories like months, weeks, and quarters.
- It first checks what today’s date is and uses this to figure out the current year and month.
- If it’s December, the calendar prepares to include next year as well.
- Then, it creates a detailed calendar starting from January 1, 2019, to the end of the current or the next year.
- For each date, it adds extra useful details like the month name (like Jan, Feb), the week number, and which quarter of the year it is.
- It also formats these dates in an easy-to-read way and marks days of the week (like Mon for Monday).
In simple terms, it’s like having a super-detailed planner that automatically updates itself based on today’s date, helping you analyze your data in different time dimensions more effectively.
Now you have a dynamic date table created with DAX: Below a snapshot of the table::

Conclusion
Incorporating a dynamic Date Table in Power BI into your data analysis toolkit is not just about following best practices. It is about transforming the way you handle time-related data in Power BI. Date Tables enhance data analysis, ensure up-to-date data, and align perfectly with the efficient and flexible nature of Power BI. You can easily adjust this table and add more calculated columns if needed.
If you find this article helpful, I’d be happy to get a comment 🙂

