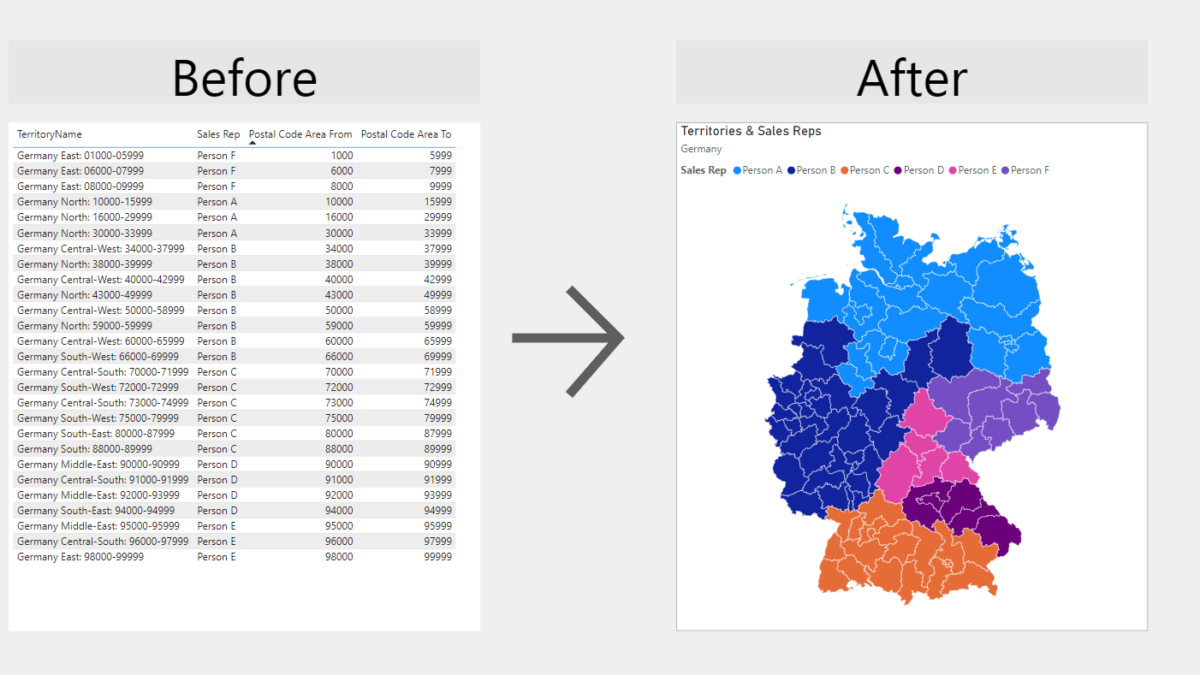
Why is a Territory Report Useful?
Imagine this: Your company has defined sales territories and sales representatives and your task is to visualize which sales representative is responsible for which area. We don’t want to simply visualize it in a boring and not user friendly table. Let’s say, you want to use the Power BI shape map and visualize the data. hoose? In this article, I will explain how to create a dynamic Territory Report in Power BI!
Choosing the right level of granularity for your map
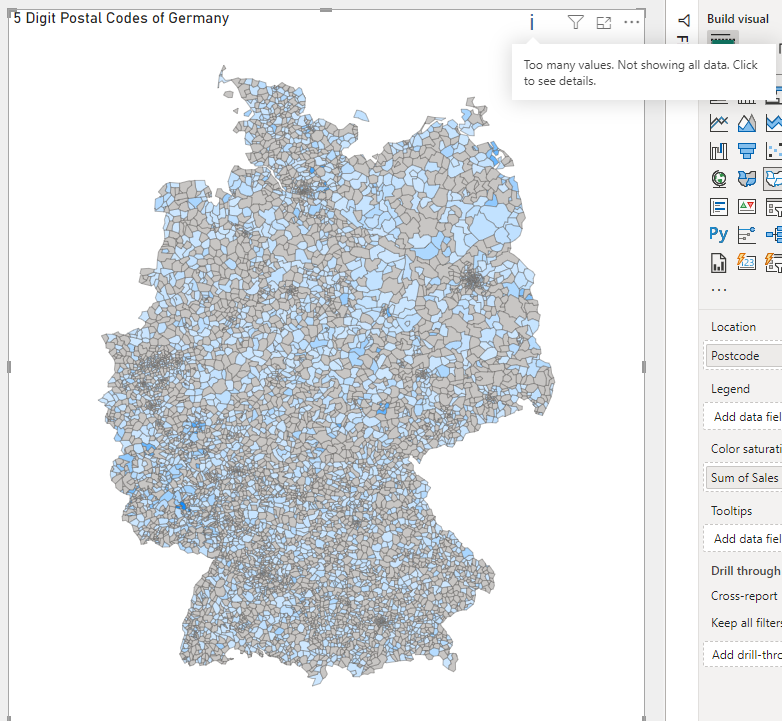
When it comes to sales, seeing where things are happening on a map is super important. This is especially true in a place like Germany, where there are lots of different areas to keep an eye on. That’s why we need a good way to show sales on a map. But here’s the thing: using a map that only shows states or one with every single zip code doesn’t work well for us. Why? Because state maps don’t give us enough detail, and maps with every zip code are just too crowded and the Shape Map in Power BI cannot even show all postcodes as there is a limit of around 4000 Polygons per map!
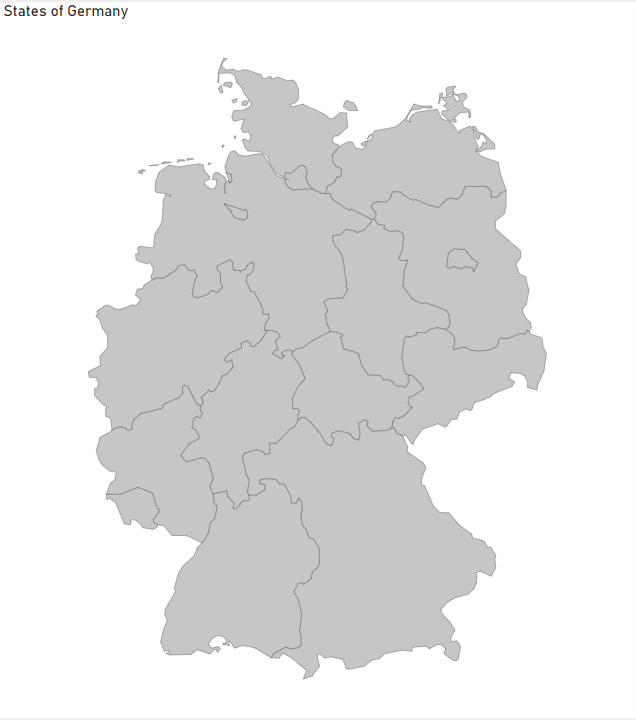
Visualizing the States of Germany
The state (Bundesländer) map is not granular enough and doesn’t give the right level of details as the territories are defined in Postcode areas and defined within states!
Visualizing 5 Digits Postal Codes
As mentioned above, this level of details is too much for Power BI. It is not a good way to create a Territory Report in Power BI with this level of detail! Not all of the Zipcodes can be shown and it is very hard to read and understand the map with all the boundaries. Moreover, as you can see, not all postal codes are filled out as there are too many values for Power BI. As a result, not all data points are shown!
2 Digits Postcode Area
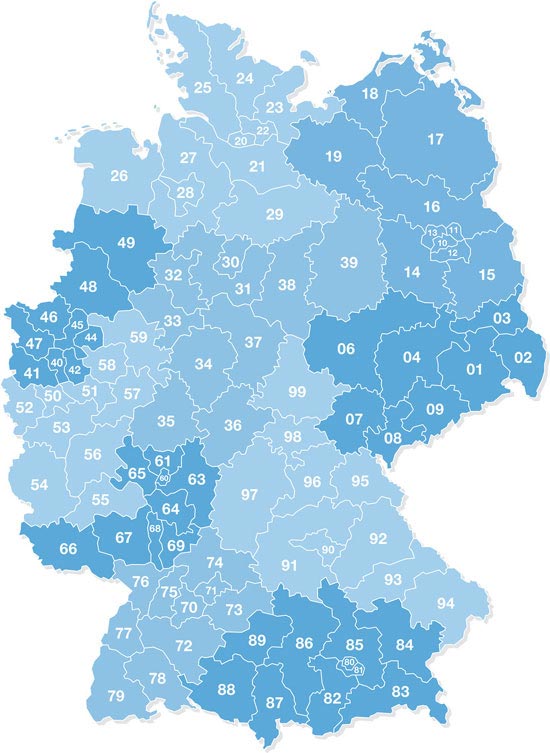
In our example, we categorize territories using ‘from and to’ postcodes, like from 31000 to 39999. These values are stored in two separate columns. The most important part are the two leading digits of the postcodes. They define in which sales area we are! So our goal is to find a map that shows the 2 digit postcode area of Germany. You can find an example of a two digits postcode map in Germany here. For our example, we then know that all the postcodes (31, 32, 33, 34, 35, 36, 37, 38, 39) are part of one territory.
This way, we don’t get lost in too many details, but we still see enough to know where sales are hot and where they’re not. It’s all about making a map just right for our sales team to use easily.
The data model
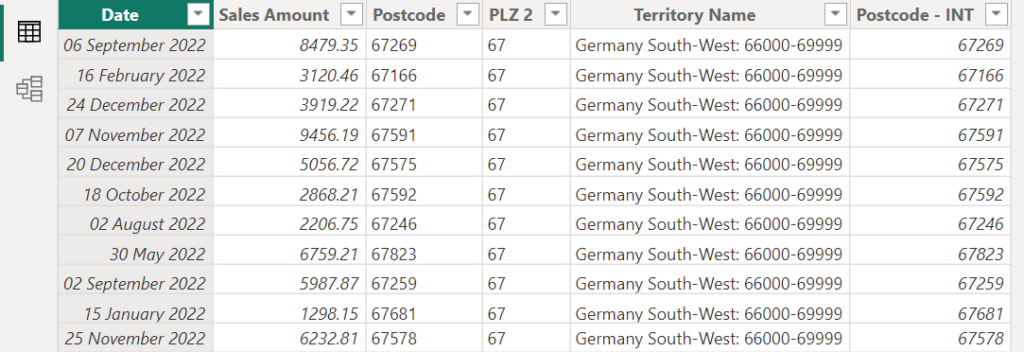
Our data model is simple. I created some fake sales data with ChatGPT. I have a data, sales and postcode column. This is my fact table. One Postal Code can have multiple Sales entries throughout the year!
For the visualizations I added a column called “PLZ 2” which is giving me the first 2 digits from the postcode column. This is very important and we need to match this column with the content from the GeoJson file! More on that later.
The “Territory Name” column is a calculated column which assigns the right Territory to each row based on the Postcode.
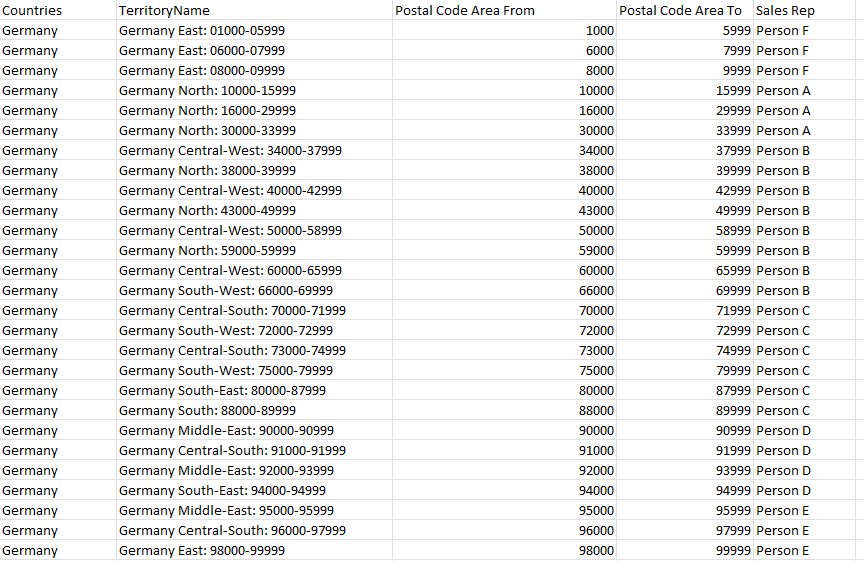
The second table “Territories DEU” table is the lookup table for managing German sales territories, featuring five columns: Countries, TerritoryName, Postal Code Area From, Postal Code Area To, and Sales Rep. This table helps in categorizing Germany into distinct sales regions based on postal code ranges, from start to end, and assigning each to a specific sales representative.
Create a new calculated column for Territory Report in Power BI Fact Table
The calculation “Territory Name” in Power BI is designed to link your sales data with the correct sales territory. It uses the CALCULATE function to pick the right territory name from the “Territories DEU” table based on postal codes. The FILTER part of the formula checks each sale’s postal code and finds which territory it falls into by comparing it with the ‘from’ and ‘to’ postal code ranges in “Territories DEU”. This way, every sale gets accurately matched to its respective sales territory, making your data more organized and meaningful.
Territory Name =
CALCULATE(
    MAX('Territories DEU'[TerritoryName]),
    FILTER(
        'Territories DEU',
        'Postcode Sales'[Postcode - INT] >= 'Territories DEU'[Postal Code Area From] &&
        'Postcode Sales'[Postcode - INT] <= 'Territories DEU'[Postal Code Area To]
    )
)
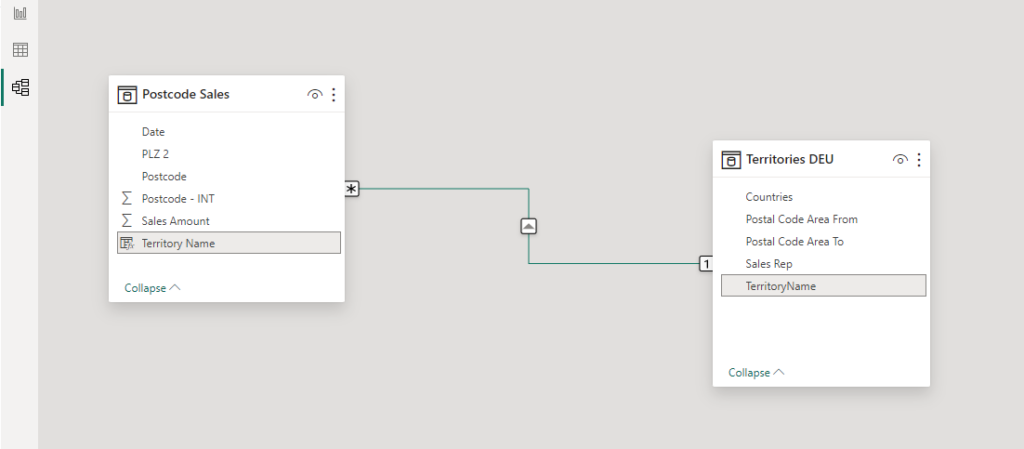
The data model view.
Now we can connect both tables based on the Territory Name columns. The Postcodes Sales Table is our fact table with the newly calculated column. This column defines the Sales Territory Name based on the Postal Code we are in. Overall, we have a 1-to-many relationship with the filter direction from the lookup table “Territories DEU” to the fact table “Postcode Sales”
Implementing The Territory Report in Power BI: Step-by-Step
Let’s break down how to create a Territory Report in Power BI, step by step.
What is a Geojson File and How to Find a Geojson File:
Geojson files are crucial for mapping in Power BI. These files contain geographic data, such as the boundaries of your territories. Finding the right Geojson file for your region is the first step. A simple web search for ‘Geojson files for [your area]’ should lead you to what you need. Often you also find valuable geosjon files on github! In our case I found a publically available Geojson file on the suche-postleitzahl website. Simply select the 2 digits (2 stellig) geojson file and download it.
In this case, I was lucky to find the right granularity of the map! For instance, I wanted to do the same for Switzerland but I could not find the 2 digits geojson file. I had to use the 4 digits postal code map and combine all the polygons using QGIS map. I will create another blog post explaining the details of that step soon!
Convert Geojson into Topojson file using mapshaper
When using Shape Maps in Power BI, it’s essential to convert Geojson files into Topojson format, as Shape Maps specifically require this file type. Mapshaper comes in handy for this conversion, efficiently transforming your Geojson data into the more streamlined Topojson format. This step ensures compatibility with Power BI’s Shape Maps, enabling you to create detailed and efficient geographical visualizations with your data.
- Go to https://mapshaper.org/
- Upload your geojson file to mapshaper.org
- Click on Export
- Choose TopoJson
- Click Export again
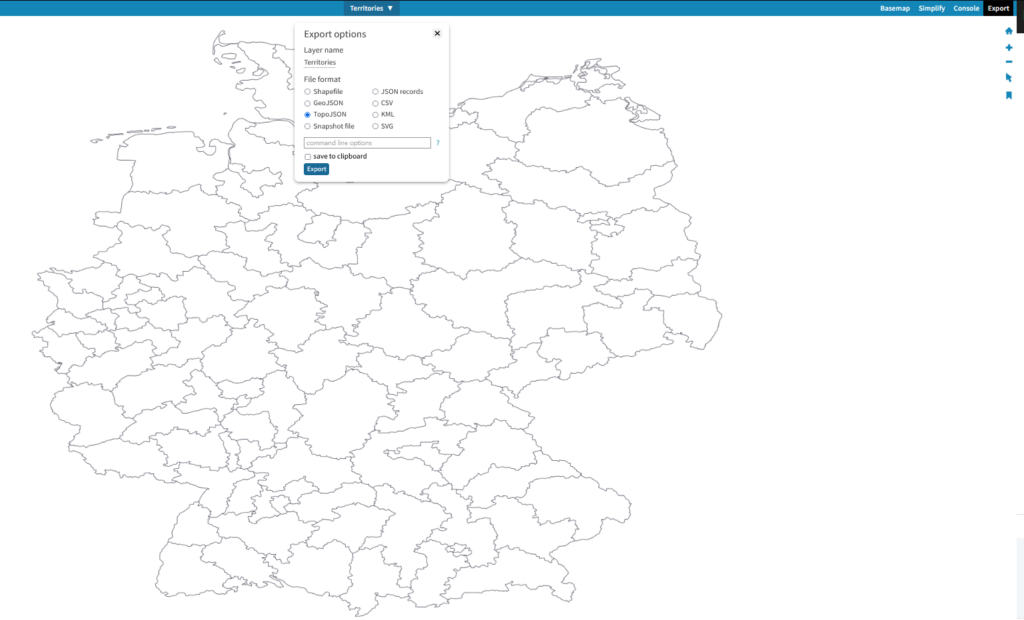
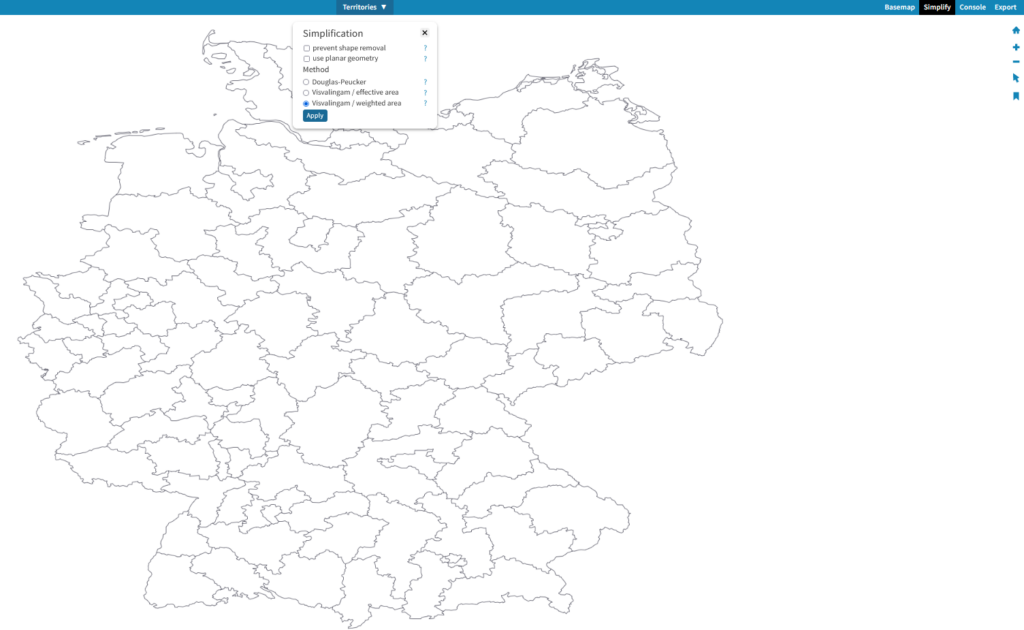
Additionally, you can use mapshaper to reduce the file size by almost 100%! You can use the simplify the polygon lines. The more you simplify the less details you get. You have to find the right balance. You can select the method like on the screenshot below. Once you click apply you will see a scrollbar from 100% ranging to 0%. Zero% would be the least detailed. I usually stop at around 3-4 %
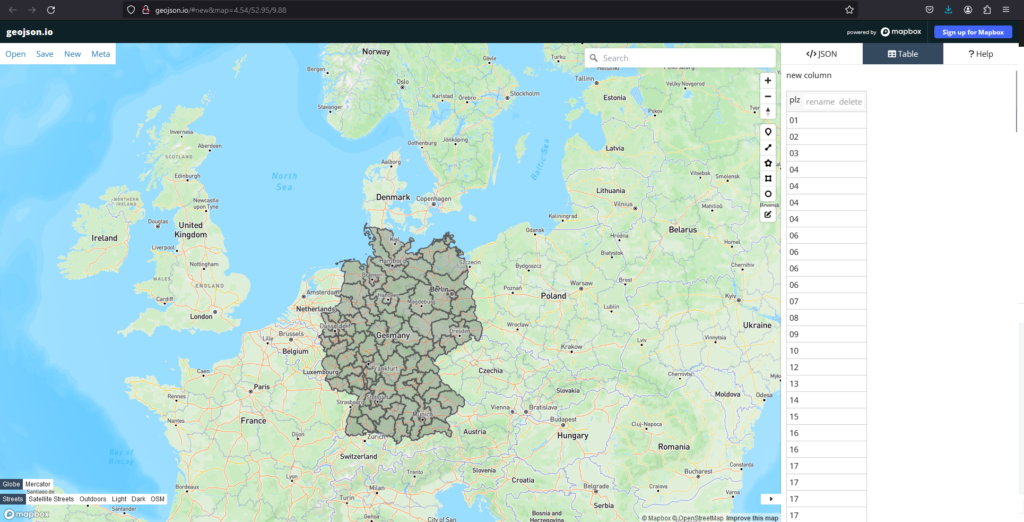
Go to Geojson.io to understand the table attributes of GeoJson file
Each Geojson file has attributes that are stored in Json format. It is not always easy to read a geojson format but it is crucial to understand what columns the file has. Later in Power BI you need to match these column attributes. For instance, on geojson.io you see that the current GeoJson file of Germany has a table with one column called “PLZ”. For that, simply drag and drop the TopoJson File that you downloaded from the previous step. If you click on the numbers in the table, you will be redirected to the selected poylgon on the map. Later you need to match these names in Power BI as well. Let’s say of we don’t have a 2 digit postal code “14” this part of the map will be greyed out in Power BI. This step is crucial to understand!
How to read a GeoJson file in Notepad?
Alternatively, you can open the GeoJson file also with the standard notepad application. You will see a lot of text and numbers but don’t get too confused. It looks complicated, but it is actually relatively easy to understand. Here is a breakdown of the GeoJson code. In my example the GeoJson file had 2 columns:
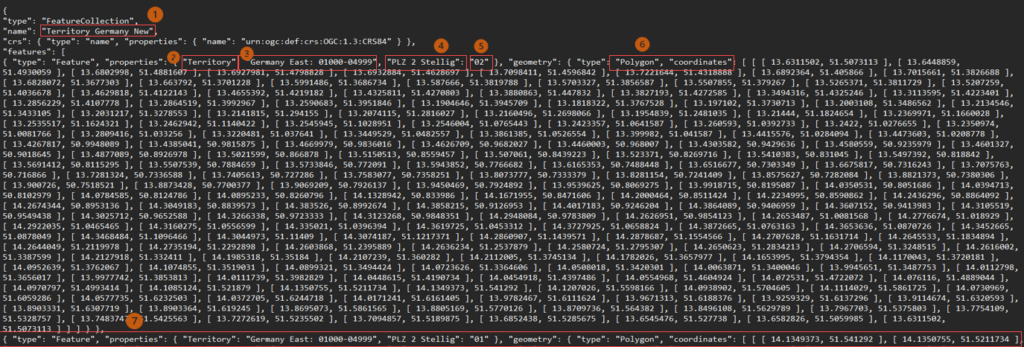
- File name = “Territory Germany New”
- First column name = “Territory”
- Column Value of the first column = “Germany East: 01000-04999”
- Second column name = “PLZ 2 stellig”
- Column value of the second column = “02”
- List of coordinated (latitude & longitude). Each pair is representing one corner of the polygon.
- New row of the table starting with the same logic as above
Include geojson file in Power BI Shape Map
Search for the shape map icon between all the different visuals and select it. Now drag any column in the rows or column, that does not really matter. First, you will always see the image of the USA state map. You need to select the custom map and then select the topojson file that you have downloaded before!

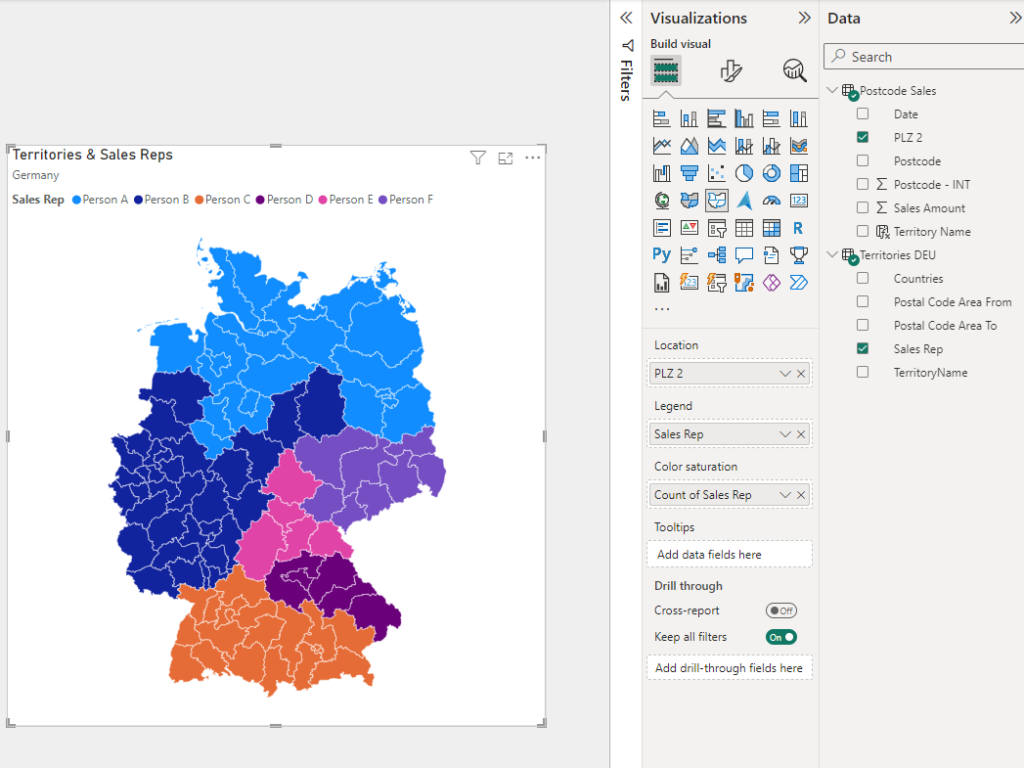
Next, get the “PLZ 2” which is our two digit postal code column from the Fact table into the location field. This step is very important, if there was any non matching field from the geojson file with the fact table column, then one of the polygons would be greyed out! In here, everything is blue, which means the data matches in Power BI and in the GeoJson file!
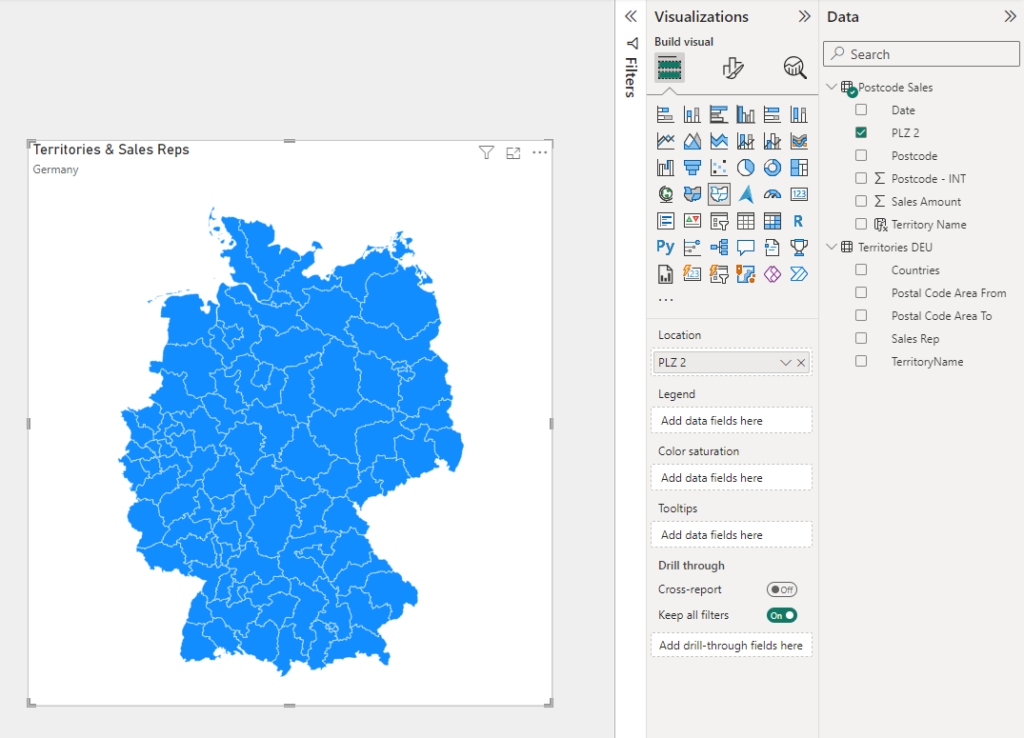
Next, drag the Sales Rep from the Lookup table in the Legend and color saturation fields. The legend is very important here, this defines the colors of the map:
4. Conclusion
Now you have an understanding of how to use and find GeoJson files and how to import them in Power BI! If you have any questions, please feel free to ask them in the comment section below!
👇
.
.
.
.

