This post is part of my series on making Power BI reports more dynamic. Today, we’re exploring Power BI drill-through vs. drill-down. These features are essential for interactive reporting and are easy to set up without complex DAX measures. Let’s break down what each feature does, their benefits, and how to use them in your reports.
What Is Power BI Drill-Through?
Drill-through in Power BI allows you to jump from a summary page to a more detailed report page. For example, if you have a dashboard showing overall sales performance, you can right-click on a data point, select Drill-through, and instantly navigate to a page with deeper insights for that specific category or region. This is particularly useful when you want to provide users with focused information without overwhelming your main report.
I’ll include a short video showcasing the drill through feature. In my case the sales for Norhtern Europe have been almost 18% lower year over year. Now your manager asks you: “I don’t believe that data”! Or “Can you show me more details? I want to understand how we ended up with these values!” No Problem, we right click on the red area, select Drill Through and then the details page (Be careful when you have multiple Drill Through Pages, naming is important here!).
Drill-through is great for situations where you need a separate page dedicated to exploring detailed metrics or specific data segments. It gives users a structured way to navigate through reports while keeping the main dashboard clean and focused.
How to set up the Drill Through in Power BI?
It’s easy to set up the Drill Through feauture:
- Create a new details page e.g. with transaction level details (depending on your use case)
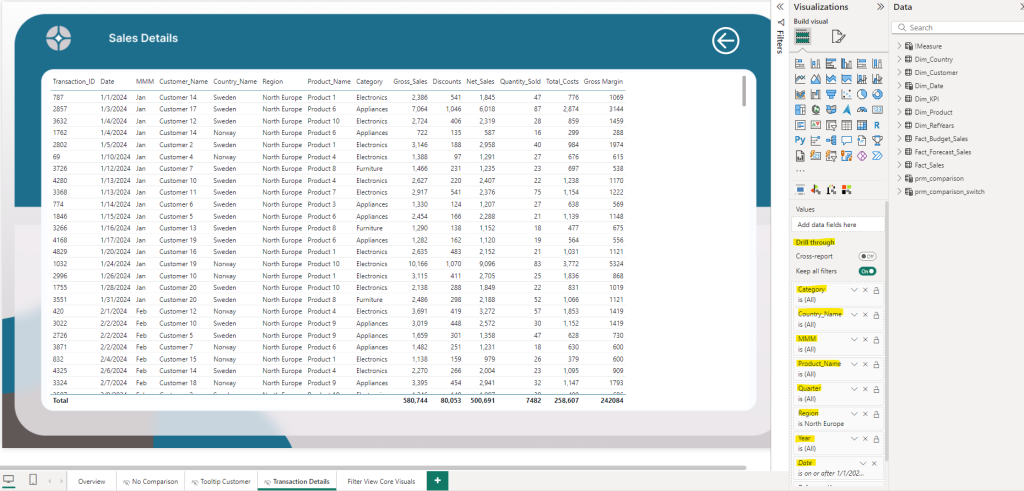
- Think of your summary page. Which columns / fields to you use? I use for instance month, Quarter, Year, Product Segment, Product, Region and Country
- Add those columns to the Details page. Under Visualizations search for Drill Through
- Important: If you don’t add a certain column to the Drill Through fields, you won’t be able to drill through this category!

What Is Power BI Drill-Down?
Drill-down is another powerful feature, but it works differently. Instead of moving to another page, drill-down allows users to dig deeper into a single visual. For instance, you could start with a high-level view showing yearly sales. By clicking on a specific year, you can drill down into quarterly or even monthly data within the same chart. This keeps users engaged in one visual while still providing layered insights.
Setting up drill-down is simple. It requires a hierarchy in your data model, such as year > quarter > month. Once the hierarchy is in place, enable the Drill-down feature on the visual. Users can then explore multiple levels without leaving the page, making it easy to get detailed information without interrupting their workflow. The video below showcases how to change the yearly view into a monthly view (or the other way around).
How to set up the Drill Downs in Power BI?
Drill-down is perfect for reports where quick exploration is key. Users can move between data levels instantly, helping them spot trends or patterns without needing to switch views.
The Drill Down / Up Feature requires a hierarchy. In our case, we used our date table which has a monthly, quarterly and yearly aggregation. You can either use this way of manually pulling in the columns or use the Power BI automatic hierarchy (if you enabled the settings). In this case, I used the manual way and added Month (MMM Format), Quarter and Year. For that, you need to put your categories in the Category field.
If you have a product hierarchy like Product, Product Category, Segment the logic would be the same. Put the highest level first, then the second level and lastly the lowest level.

Final Thoughts
Both drill-through and drill-down are crucial tools for dynamic Power BI reporting. They enhance user experience by making it easy to explore data at multiple levels. Drill-through is ideal for guiding users from summary to detail across different report pages, while drill-down keeps everything within one visual, making data navigation seamless and interactive. These features are easy to set up and don’t require DAX, making them accessible even for beginners using Power BI drill-through versus drill-down.
Still Confused? Power BI Drill Through vs Drill Down
Download my free Power BI Desktop file that contains everything you need to set up tooltips correctly!
Want to make your report more actionable and dynamic? View my latest post:
Using Power BI Dynamic Values for Flexible Reporting

