Power BI is a fantastic tool for creating powerful data visualizations, offering endless possibilities for turning raw data into meaningful insights. However, let’s be real—many people still prefer the comfort of familiar tools like PowerPoint for their presentations. It’s understandable; PowerPoint is tried and true, a go-to for years. But what if you could have the best of both worlds? In this article, I show you how to export Power BI to PowerPoint
In this article, I’m going to show you a few ways to get your Power BI visuals into PowerPoint. We’ll explore some automatic methods that make this process quick and easy, as well as a few manual tricks for those who want more control. However, speaking from experience as a Power BI analyst, I’ll also share why sticking with Power BI for your reports can provide you with so much more flexibility and insight. Stick around to find out why at the end!
Why Export Power BI Reports to PowerPoint?
Ease of Presentation
Exporting Power BI reports to PowerPoint simplifies the process of sharing data insights with stakeholders. PowerPoint is a widely recognized tool in corporate environments, making it easier for presenters to communicate their points clearly. By exporting your Power BI visuals directly into PowerPoint, you ensure that your data is presented in a format that is both familiar and effective for your audience.
Enhanced Collaboration
PowerPoint’s collaborative features, such as shared editing and commenting, make it an ideal platform for team presentations. Once your Power BI report is exported to PowerPoint, it can be easily shared with colleagues, allowing for collaborative refinement of the presentation. This ensures that everyone involved in the presentation process can contribute to crafting a polished final product.
Customizability
One of the key advantages of exporting Power BI reports to PowerPoint is the ability to customize your data for different audiences. PowerPoint allows you to rearrange, resize, and edit your visuals to better suit the needs of your presentation. This flexibility means you can highlight specific insights or adjust the presentation’s focus based on your audience’s preferences.
Offline Access
While Power BI is a powerful online tool, there are times when you might need to present your data offline. Exporting your Power BI reports to PowerPoint ensures that you have access to your data even in environments without an internet connection. This is particularly useful during in-person meetings or when traveling to locations with unreliable internet access. Live connections do need an internet connection!
Methods to Export Power BI reports to PowerPoint
Method 1: Using Power BI Service
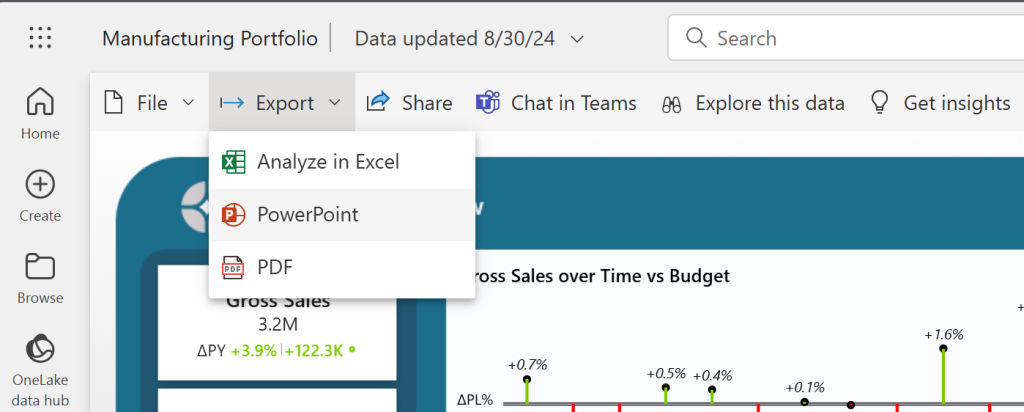
The most effective way to export Power BI reports to PowerPoint is through the Power BI Service. This method offers two options: exporting with a live connection to the report or using screenshots from the current report page.
- Access Power BI Service: Log in to the Power BI Service via your web browser.
- Locate Your Report: Navigate to the report you want to export.
- Export Options:
- Go to Export Option and select PowerPoint
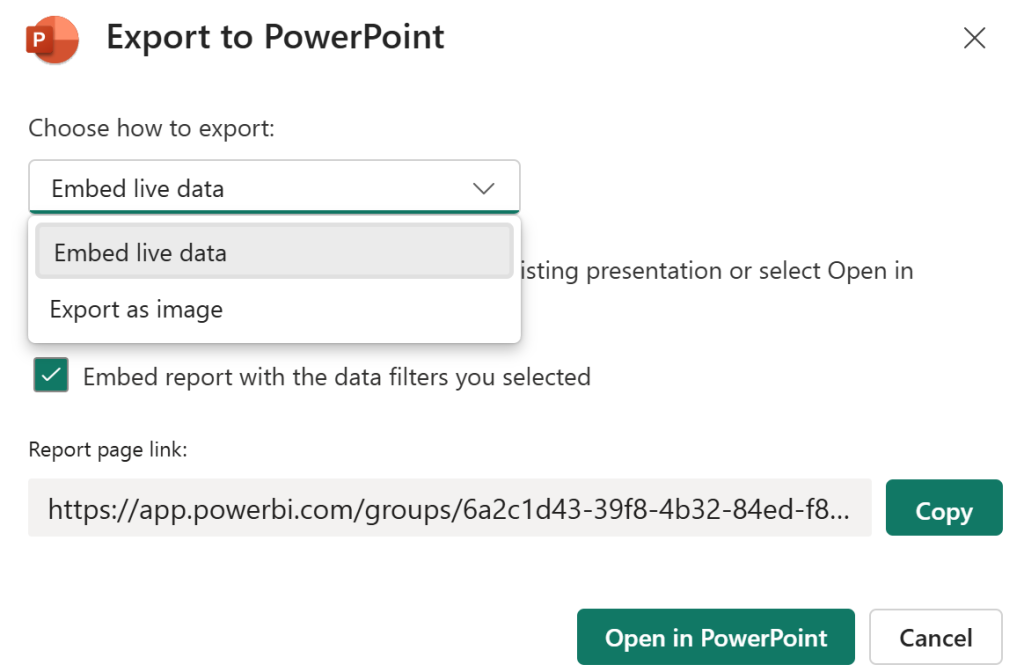
- Live Connection: Choose this option if you want your PowerPoint slides to be linked to the live Power BI report. This allows for real-time data updates, making your presentation dynamic.
- Screenshot Export: If you prefer to export static images, select the option to export screenshots of the current report pages.
- Complete the Export: Follow the prompts to finish the export process, then download the PowerPoint file.
What is a Live Connection in PowerPoint?
A Live Connection in Power BI to PowerPoint is an export option that allows you to embed a live, interactive version of your Power BI report directly within your PowerPoint presentation. When you choose this method, the visuals in your PowerPoint slides are linked to the original Power BI report. This means that any changes or updates made in Power BI will automatically be reflected in your PowerPoint presentation. The live connection keeps your data dynamic, allowing you to filter, drill down, and interact with the visuals in real-time during your presentation.
The primary difference between a live connection and a standard export (such as using screenshots or PDF exports) is interactivity and data freshness. While standard exports create static snapshots of your data that do not update and cannot be interacted with, a live connection maintains the full interactive capabilities of Power BI, allowing you to dive deeper into the data directly within PowerPoint. However, the live connection requires an internet connection to function and access the Power BI Service, whereas static exports can be used offline. Additionally, live connections are ideal for situations where up-to-date data is crucial, while static exports are best when you only need a fixed view of the data for straightforward presentations.
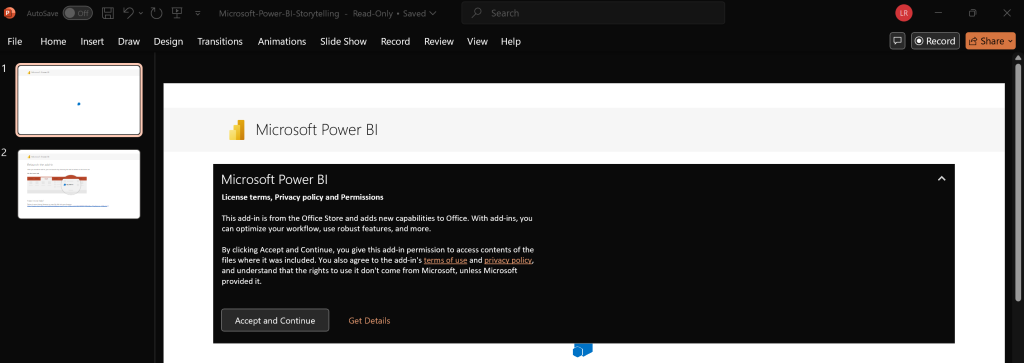
Once you select download the live connection, and you open the PowerPoint report you need to agree with Microsofts terms and conditions.
Limitations of a Live Connections
- Limited Interactivity:
- Only supports basic filters and drill-through.
- Lacks advanced features like cross-filtering, slicers, or seamless page navigation.
- Requires Internet Connection:
- Needs a stable internet connection to function properly.
- Risk of delays, lag, or visuals not loading if the connection is slow or unstable.
- Slide-by-Slide Nature:
- Presentation is constrained by PowerPoint’s linear, slide-based format.
- Can’t explore data as flexibly as in Power BI.
- Slower Data Exploration:
- Presenting directly in Power BI is faster and optimized for real-time interaction.
- PowerPoint may lag or require waiting for data to load.
Power BI Presentation vs. Live Connection
- Power BI:
- Offers full interactivity with all filtering, drill-downs, and dynamic navigation.
- Allows for a flexible, fluid presentation, adapting to audience questions on the fly.
- Supports advanced features like bookmarks and spotlights to guide storytelling.
- Live Connection in PowerPoint:
- Provides some interactivity, but still limited compared to Power BI.
- More structured, following PowerPoint’s traditional slide format.
- Better for scenarios needing basic interaction but not full data exploration.
In summary, presenting directly in Power BI offers a richer, more dynamic experience. A live connection in PowerPoint is a compromise but lacks the full flexibility of Power BI’s interface.
Metho 2: Connect directly from PowerPoint (Power BI Add on required)
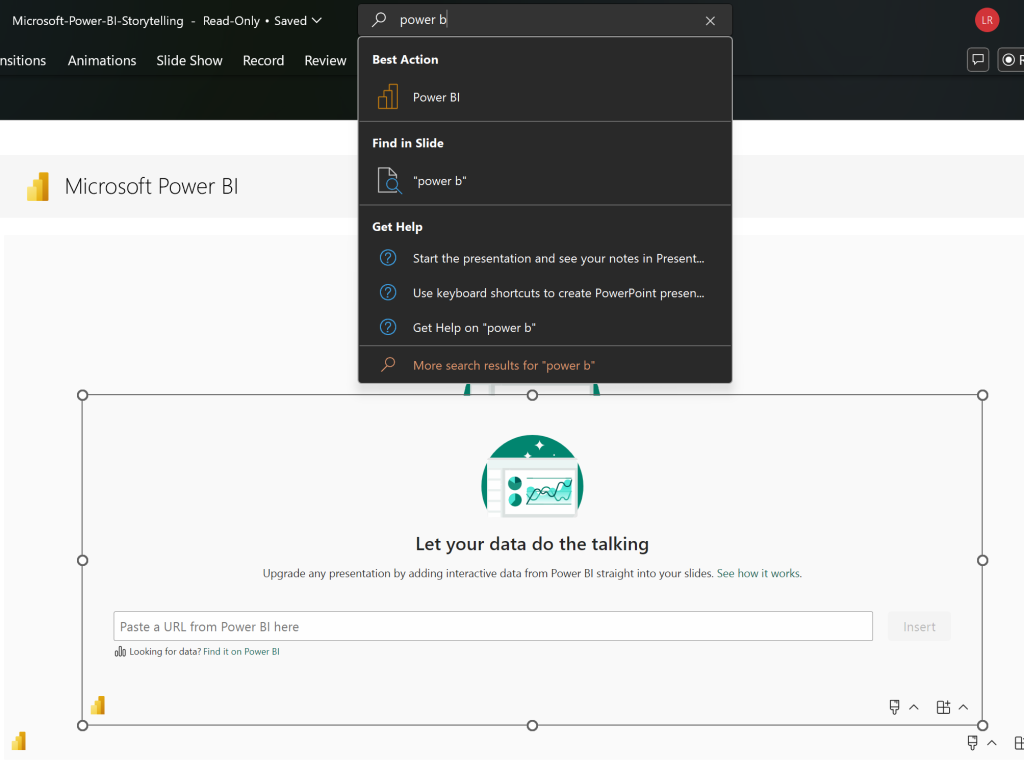
In order to work with Power BI in PowerPoint, you need to install the Power BI add on. You can search for add on or Power BI in the search bar and simply add it. Afterwards a window will pop up where you can also enter the link directly that you received earlier when exporting the live connection report.
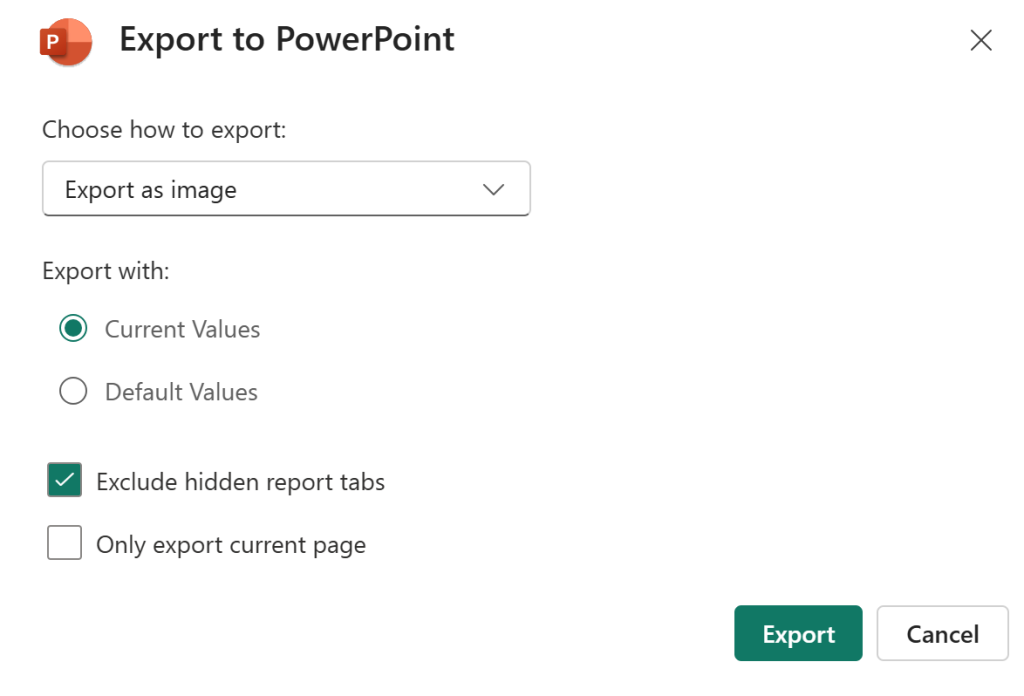
Export as Image
You can choose to only export the Report as images (which are basically screenshots). After selecting this options Power BI asks you if you want to export all pages or only the current one. Regarding the first option, I usually go with the “Current Values” option:
Method 2: Manual Screenshot and Paste
For users who want full control over how their visuals appear in PowerPoint, manually taking screenshots of Power BI visuals and pasting them into PowerPoint slides is another option. Although more labor-intensive, this method allows for precise placement and customization of each visual.
- Capture Screenshots: Use your computer’s screenshot tool to capture the visuals from your Power BI report.
- Paste into PowerPoint: Open your PowerPoint presentation and paste the screenshots onto the slides.
- Adjust Visuals: Resize and position the visuals as needed, ensuring they align with the rest of your content.
PDF Export as an Alternative
While there is no direct way to export Power BI reports from the desktop version to PowerPoint, you can export your report as a PDF. This PDF can then be converted into PowerPoint slides using various tools, though this may require some manual adjustments to ensure the visuals and text appear correctly.
- Export to PDF: In Power BI Desktop, go to “File,” select “Export,” and choose “PDF.”
- Convert to PowerPoint: Use an online tool or software to convert the PDF into PowerPoint slides, then edit as needed to refine the presentation.
Pros and Cons of Exporting Power BI to PowerPoint
Pros:
- Familiarity: PowerPoint is a familiar tool for many, making it easier for users to adapt.
- Offline Access: Exported reports can be viewed and shared without an internet connection.
- Customizability: PowerPoint allows for customization of the exported visuals to better suit different audiences.
- Collaboration: PowerPoint’s shared editing and commenting features enhance teamwork.
Cons:
- Static Content: Once exported, the content becomes static, losing the interactivity and dynamic filtering capabilities of Power BI.
- Limited Insights: Exporting to PowerPoint may limit the ability to drill down into the data and explore additional layers of insight.
- Manual Updates: If the data changes, the exported PowerPoint slides need to be updated manually, which can be time-consuming.
- Loss of Interactivity: Even with dynamic filters, the interactive experience is still limited compared to using Power BI directly.
Step-by-Step Guide to Exporting Power BI reports to PowerPoint
Step 1: Prepare Your Power BI Report
Before exporting, it’s crucial to optimize your Power BI report. Ensure that all visuals are clear, properly formatted, and convey the insights you want to highlight. This preparation step can save you time in editing once the report is in PowerPoint.
Step 2: Navigate to the Export Option
Once your report is ready, navigate to the export option in the Power BI Service. Depending on whether you want a live connection or static screenshots, you can choose the appropriate export method.
Step 3: Customize Export Settings
When exporting, you’ll have the option to customize the export settings. This may include choosing the slide layout, selecting specific pages or visuals to include, and adjusting the resolution of your images. Tailor these settings to ensure your PowerPoint slides look polished and professional.
Step 4: Finalizing and Editing in PowerPoint
After exporting, open the PowerPoint file to review and make any necessary adjustments. You may want to edit text, rearrange visuals, or add annotations to better align the content with your presentation’s narrative. This step is essential to ensure that your data is communicated effectively.
Common Issues and Troubleshooting
Occasionally, you might encounter issues during the export process, such as low-resolution images or missing data. Common fixes include checking your export settings, ensuring your Power BI visuals are properly configured, and updating to the latest version of Power BI. If issues persist, consult Microsoft’s support resources or community forums for further assistance.
Best Practices for Presenting in PowerPoint
Maintain Visual Consistency
Consistency is key when transitioning from Power BI to PowerPoint. Ensure that your color schemes, fonts, and visual styles match between the two platforms. This creates a cohesive look that enhances the professionalism of your presentation.
Highlight Key Insights
Not all data points are created equal. When presenting Power BI data in PowerPoint, focus on highlighting the most significant insights. Use bold text, larger visuals, or strategic placement to draw attention to the information that matters most to your audience.
Interactive Elements
PowerPoint offers the ability to add interactive elements like hyperlinks or embedded dashboards. Consider embedding a live Power BI dashboard directly into your PowerPoint slide for a dynamic presentation experience. This allows your audience to explore the data in real-time during the presentation.
Storytelling with Data
Effective data presentations are more than just a series of charts—they tell a story. Use your Power BI visuals to craft a narrative that guides your audience through the data. Start with an introduction that sets the context, build up to key insights, and conclude with actionable takeaways.
Conclusion
When creating reports, it’s essential to build them in a way that users feel comfortable using. While exporting to PowerPoint has its benefits, Power BI just offers so much more—more insights, more interactivity, and more value. Even when using dynamic filter exports to PowerPoint, you miss out on the full range of possibilities that Power BI provides. You can start at a high level and then drill down to the next layer of data, enabling you to answer all your questions in one meeting.
Think about it: no more “let me check the data and get back to you.” With Power BI, you have the ability to explore and analyze data on the spot, instantly answering any question that arises. Of course, this requires a good understanding of Power BI, and many people still feel more comfortable using static PowerPoint slides. But if you’re willing to embrace the learning curve, Power BI can truly transform how you present and understand your data.
Got curious to learn more about my blog posts? Check out my latest blog post series: 8 Tips to Create an Interactive Power BI Dashboard.
Did you enjoy reading this article? I’d be happy to receive a comment 🙂

