In today’s data-driven world, the ability to harness vast amounts of information effectively is crucial for every organization, regardless of size or sector. As data volumes are expected to reach staggering new heights—nearly doubling to 160 zettabytes by 2025—the need for robust data analysis tools has become paramount. Microsoft’s Power BI Desk Top is at the forefront of this revolution, transforming the way businesses understand and interact with their data.
Introduction to Power BI Desk Top
Power BI Desk Top is a powerhouse in the realm of business intelligence, offering users an array of sophisticated tools to extract meaningful insights from complex data sets. Designed to cater to both seasoned analysts and those new to data science, Power BI Desk Top ensures that all users, regardless of their technical expertise, can leverage its capabilities to enhance decision-making processes.
This platform not only simplifies the task of data aggregation and analysis but also democratizes data visualization, making it accessible to a wider audience within any organization. Its intuitive interface, combined with deep integration capabilities within the Microsoft ecosystem, ensures that users can start delivering impactful insights quickly, without a steep learning curve.
Core Features of Power BI Desk Top
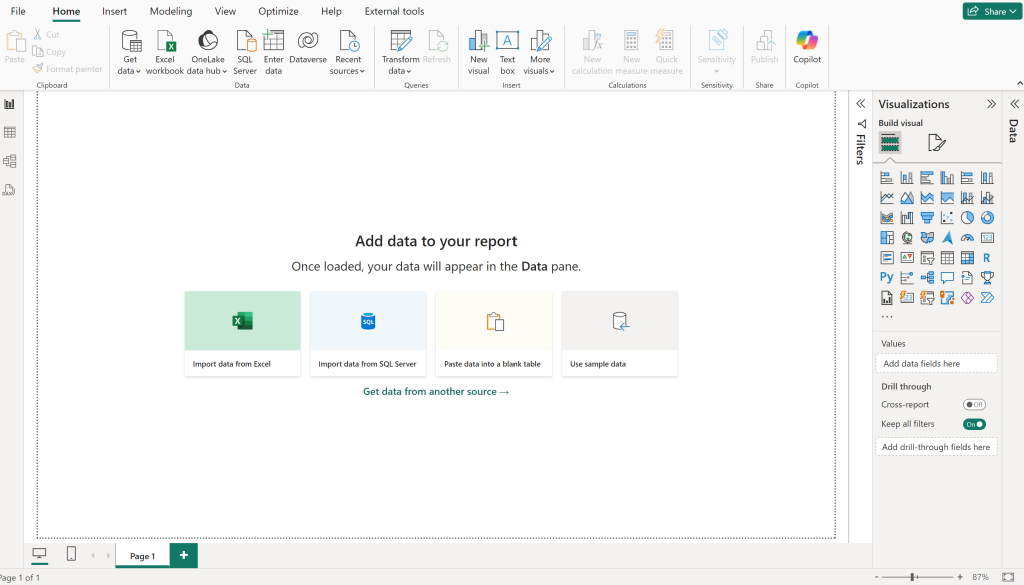
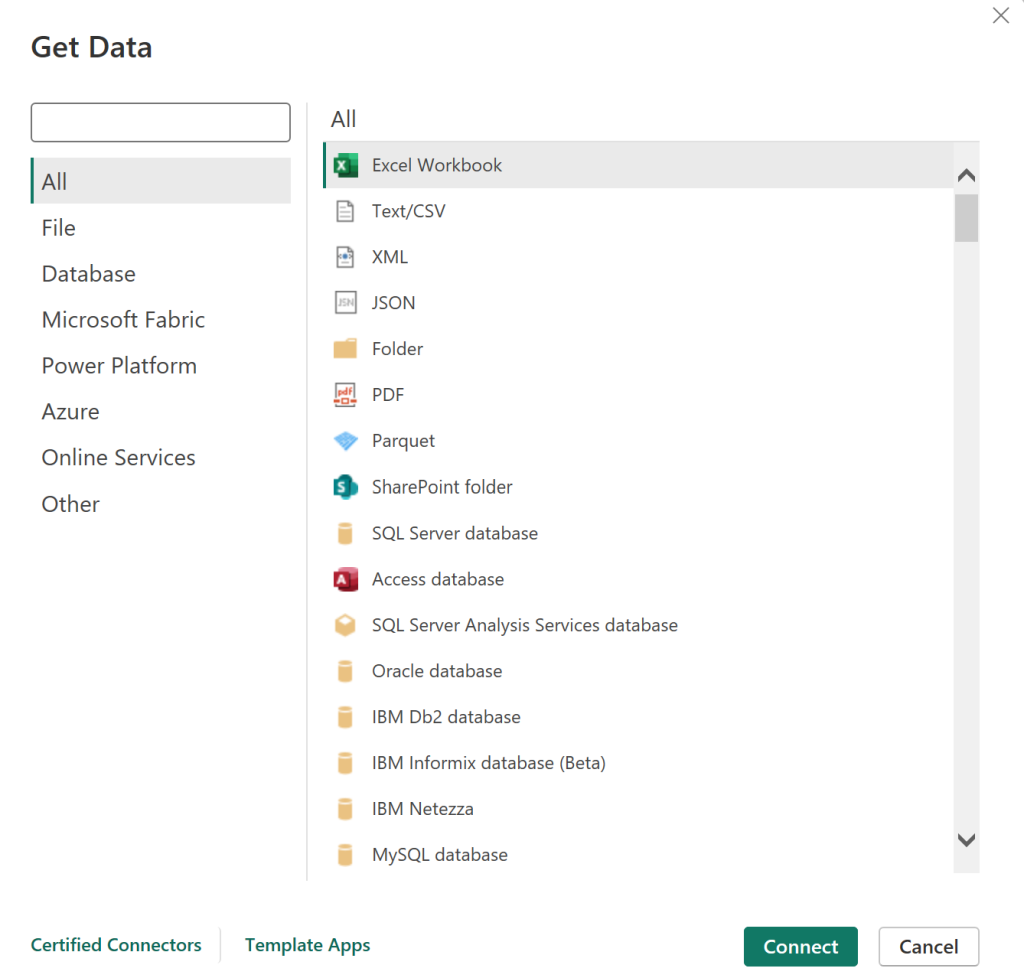
Comprehensive Data Integration Power BI Desk Top stands out for its ability to connect seamlessly with a vast array of data sources, including cloud-based services, databases, and direct data feeds. This integration allows users to pull data from multiple sources into a single cohesive platform, where it can be manipulated and analyzed with ease.
The tool’s Power Query feature simplifies the process of data transformation and preparation, enabling users to cleanse, reshape, and combine data from disparate sources. This is crucial for organizations dealing with complex data environments, as it ensures accuracy and consistency across reports and analyses.
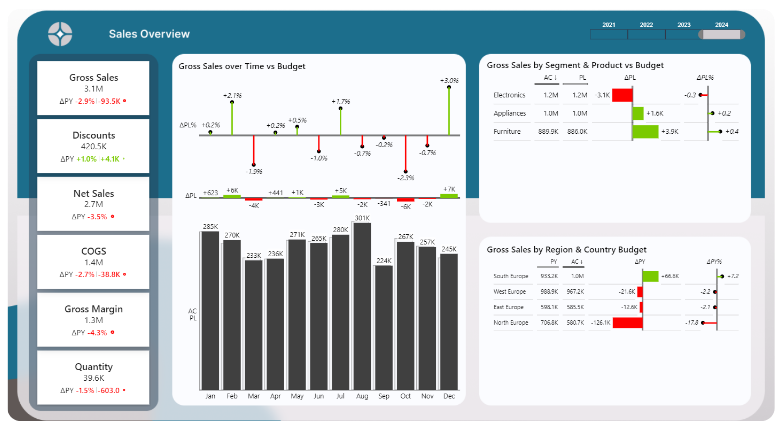
Advanced Visualization and Analytics One of the most compelling aspects of Power BI Desk Top is its advanced visualization capabilities. Users can create a variety of interactive charts, graphs, and maps that make data easier to understand and more compelling to present. These visualizations are not only customizable but also interactive, allowing end-users to drill down into the metrics that matter most to them.
Moreover, with the integration of DAX (Data Analysis Expressions), Power BI Desk Top provides powerful analytical capabilities that go beyond traditional reporting. Users can define custom metrics and perform complex calculations, enabling deeper insights and more nuanced understanding of the data.
Versatile Applications of Power BI Desk Top
Adaptability Across Various User Groups Power BI Desk Top is uniquely positioned to cater to a broad spectrum of users—from data scientists needing advanced analytical capabilities to non-technical business users seeking straightforward data insights. Its versatility makes it an ideal choice for anyone looking to enhance their business intelligence efforts.
For technical users, the software offers extensive data modeling capabilities and the ability to write sophisticated custom expressions. For casual users, the drag-and-drop interface makes creating dashboards and reports simple, reducing dependency on IT and empowering users at all levels to make data-driven decisions.
Scalability for Any Business Size Whether it’s a small startup or a large multinational, Power BI Desk Top scales to meet the needs of any business. The tool’s robust capabilities are suitable for handling large volumes of data and complex analytical tasks, yet it remains accessible for smaller enterprises with its cost-effective pricing structure.
Real-World Applications: Portfolio Highlights
- Sales Dashboard Solution: This project underscores how real-time data visualization facilitated through Power BI Desk Top can significantly enhance decision-making processes in sales strategies. View the sales dashboard project here.
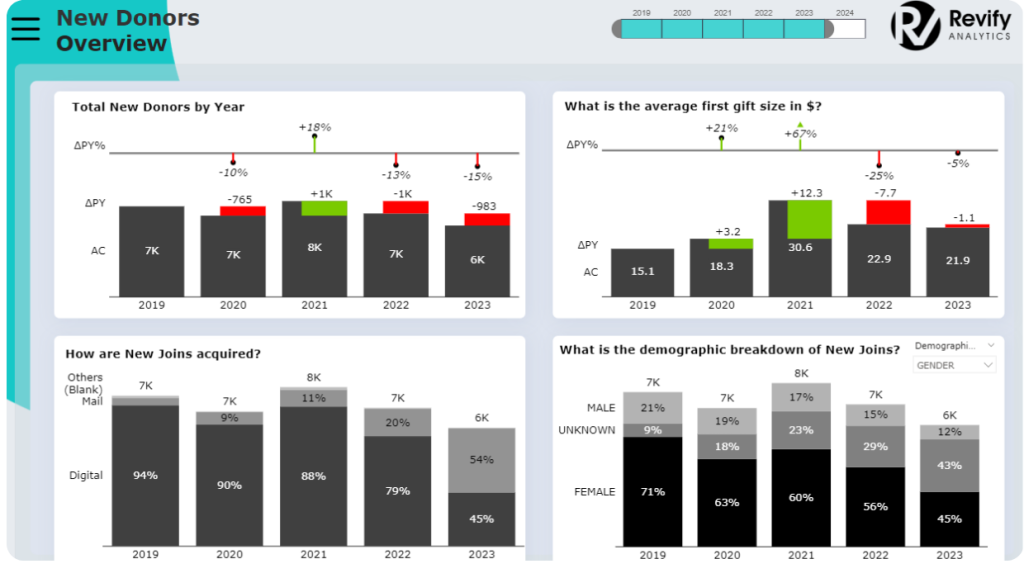
- Non-Profit Donor Analysis: Demonstrating its versatility, this use case shows how non-profits can benefit from the analytical prowess of Power BI Desk Top to maximize donor engagement and funding efficiency. Explore the non-profit dashboard project here.
How to Get Started with Power BI Desk Top
For those ready to dive into the world of advanced data analysis, getting started with Power BI Desk Top is straightforward. You can download the software for free from Microsoft’s official website: Download Power BI Desk Top. This accessibility ensures that businesses can explore the functionalities of Power BI without initial financial commitment.
Once downloaded, users can take advantage of the vast array of online resources and community forums to quickly bring themselves up to speed. Microsoft offers detailed documentation and tutorials to help new users navigate through the initial setup and begin creating reports.
Who Benefits from Power BI Desk Top?
Wide Range of Users:
Business Analysts and Data Scientists
Power BI is essential for professionals managing complex data analyses. It supports deep data modeling, statistical analysis, and report generation, allowing them to explore any dataset intricately.
Project Managers and Operations Leads
These professionals use Power BI to track project timelines and resource allocations. Integrating data from various tools, they create dashboards that offer real-time project status and resource insights.
Marketing Professionals
Power BI enables marketing teams to analyze campaign performance and market trends. This supports informed decision-making to enhance strategies and optimize ad spends.
Financial Planners and Accountants
For finance professionals, Power BI Desktop provides tools for forecasting, budget tracking, and financial reporting. It helps identify financial trends and opportunities for savings.
HR Managers
Human resources departments benefit from Power BI Desk Top by analyzing data related to recruitment, performance evaluations, and retention rates. This supports the development of more effective hiring strategies and workforce management improvements.
Healthcare Analysts
In healthcare, analysts use Power BI Desk Top to manage patient data and analyze operational efficiency. This aids in improving patient care and optimizing resource allocation.
Retail Managers
Power BI helps retail managers analyze sales data, customer preferences, and inventory levels. It enables quick strategy adjustments based on real-time data insights to maximize profits and customer satisfaction.
Educators and Academic Researchers
Educators and researchers use Power BI Desktop to analyze academic performance and manage research data. This supports enhanced teaching strategies and data-driven academic research.
Non-Profit Organizations
Non-profits leverage Power BI to track donations and manage volunteer databases. Effective data visualization aids in stakeholder reporting and optimizing resource distribution.
Government Officials
In the government sector, Power BI Destop is used to manage public data, analyze economic conditions, and monitor program effectiveness. It supports transparency and better governance through detailed data analysis.
By catering to such a diverse range of professions and industries, Power BI Desktop demonstrates its versatility and capacity to be a powerful tool in any data-driven decision-making process. Its wide applicability ensures that any user, regardless of their technical skill level or industry background, can harness the power of their data to make informed decisions.
Advantages of Power BI Desktop
1. Cost-Effectiveness: Power BI Desktopis free to download and use, which makes it highly accessible for individuals and businesses looking to explore its capabilities without financial commitment. This affordability is particularly beneficial for small businesses and startups that require powerful analytics tools but have limited budgets.
2. Comprehensive Integration: Power BI Desk Top integrates seamlessly with other Microsoft products such as Excel, Azure, and SharePoint. This integration facilitates a cohesive data environment where users can easily transfer data across platforms and enhance their workflow efficiency.
3. Advanced Data Visualization Capabilities: The platform offers a wide range of visualization tools that allow users to create highly interactive and visually appealing reports and dashboards. These visualizations help in making complex data more understandable and actionable.
4. Scalability: Suitable for both small projects and enterprise-scale deployments, Power BI Desktop can handle large amounts of data and complex data models. It grows with your business, adapting to increased needs without necessitating significant changes in the infrastructure.
5. Strong Analytical Tools: With features like DAX (Data Analysis Expressions), Power Query, and AI insights, users can perform sophisticated data analysis right on their desktop. These tools help uncover deeper insights by enabling detailed data manipulation and analysis.
Disadvantages of Power BI Desktop
1. Performance Issues with Large Datasets: While Power BI Desktop can handle large datasets, its performance can degrade when working with particularly large volumes of data or complex queries. This might require more powerful hardware or optimization of data models to ensure smooth operation.
2. Limited Real-Time Capabilities: Unlike its cloud-based counterpart, Power BI Desk Top has limitations in providing real-time data analytics. The desktop version is more suited for static reporting rather than dynamic, real-time data visualization and analysis.
3. Learning Curve: Despite its user-friendly interface, there is still a learning curve associated with using Power BI Desktop, especially when diving into more advanced functionalities like DAX and data modeling. New users might find it challenging initially and may require training to fully leverage the platform.
4. Dependency on Windows: Power BI Desktop is primarily designed for Windows users, which can be limiting for organizations or individuals using other operating systems. This can restrict its use in environments that are not Windows-based.
5. Data Security Concerns: While Power BI Desktop provides robust security features, managing data security can become challenging, especially when sharing reports externally. Users need to ensure that data is properly secured when distributing files, as the desktop version lacks some of the more advanced security features available in the Power BI Service.
By weighing these advantages and disadvantages, users can better decide how Power BI Desktop fits into their data analytics strategy and whether it meets the specific needs of their projects or organization.
The Power BI Desk Top Pricing Overview
Power BI Desk Top (Free Version)
Power BI Desk Top is completely free to download and use. It’s perfect for individual users who are diving into data analysis and visualization. With Power BI Desk Top, users have access to robust tools for data connectivity, transformation, and modeling, as well as the ability to create detailed visualizations and reports—all without any cost. This version is particularly suited for personal use, experimentation, or initial explorations of Power BI capabilities.
Power BI Pro
Power BI Pro is available at $9.99 per user per month. This version extends the capabilities of Power BI Desk Top by enabling more frequent data refreshes, collaboration through shared dashboards and reports, and more comprehensive publishing options. It’s designed for professionals and teams who need to collaborate on and share business intelligence resources within their organization, making it a vital tool for collaborative, data-driven environments.
The Power BI Premium Option
Power BI Premium offers additional enhancements and is available in two models:
- Per User: At $20 per user per month, this option includes all the benefits of Power BI Pro with additional features such as larger data volumes, faster refresh rates, and access to more advanced AI capabilities. Perfect for users who need high-performance, on-demand analytics.
- Per Capacity: Starting at $4,995 per month, this enterprise-grade solution provides dedicated cloud resources for hosting and sharing BI content within an organization without requiring recipients to have individual Pro licenses. This model is ideal for large enterprises that require a comprehensive business intelligence solution across their entire operation.
Power BI Embedded
For developers looking to integrate Power BI analytics into their applications, Power BI Embedded offers tailored pricing based on the node type and the volume of nodes needed. This allows developers to embed interactive Power BI reports and dashboards seamlessly into custom applications, providing end-users with rich, interactive data experiences.
These varied pricing options make Power BI and its extended versions highly accessible, catering to a wide range of needs from individual data analysts to large corporations. Each tier scales with business needs, providing users with powerful analytics tools. These enhance data handling and decision-making capabilities.
Conclusion
Power BI Desktop is not just a tool; it’s a comprehensive solution that bridges the gap between data and decision-making. Its ability to integrate, analyze, and visualize data on a unified platform makes it an indispensable asset for any organization aiming to thrive in a data-centric world. Whether your goal is to enhance operational efficiency, drive marketing strategies, or forecast financial performance, Power BI Desktop provides the capabilities to turn data into strategic action. Explore its potential and transform your organization’s approach to data in 2024 and beyond.
Thanks for readin it this far 🙂 I’d be happy for a comment if you liked this article.
