Quick Summary:
- Learn how to automate updating measure descriptions in Power BI.
- Connect and edit your data model using Tabular Editor 2.
- Utilize C# scripts generated by ChatGPT for bulk updates.
- Save time and enhance documentation for efficient handovers and project clarity.
Table of contents
- Introduction
- The Importance of Power BI Documentation
- Overview of Tabular Editor 2 as a Data Model Documentation Tool
- Step-by-Step Guide to Automate Power BI Documentation Using Tabular Editor 2, C# Scripts, and ChatGPT
- Step 1 – Connect Your Power BI Model to Tabular Editor 2
- Step 2 – Save the Model as a Local BIM File
- Step 3 – Upload the Model Metadata to ChatGPT
- Step 4 – Create a Documentation Table Using DAX
- Adding a table visual with Measure Information
- Step 5 – Generate C# Scripts for Measure Descriptions in Tabular Editor
- Step 6 – Verify and Finalize the Documentation
- Why Automated Documentation is Essential
- Conclusion
Introduction
Imagine working on a Power BI project with hundreds of DAX measures and columns. The idea of documenting each one manually is overwhelming, right? Without proper documentation, even the most sophisticated reports can become a maze for future users and developers. This guide will walk you through how to streamline your Power BI documentation process by using Tabular Editor 2, C# scripts, and ChatGPT. By automating much of the work, you’ll save time and ensure consistency across your data models.
The Importance of Power BI Documentation
Why Documenting Power BI Measures and Tables is Crucial
Effective Power BI report documentation is essential for maintaining clarity and efficiency within a project. Here’s why:
- Enhances Clarity: Documenting your measures and columns ensures stakeholders and developers can quickly understand your data model.
- Facilitates Project Handovers: Whether transitioning projects to a client or onboarding a new developer, thorough documentation keeps everyone on the same page.
- Ensures Maintainability: Data models often evolve. Proper documentation makes it easier to update and maintain models over time without confusion.
Manually Adding Descriptions in Power BI
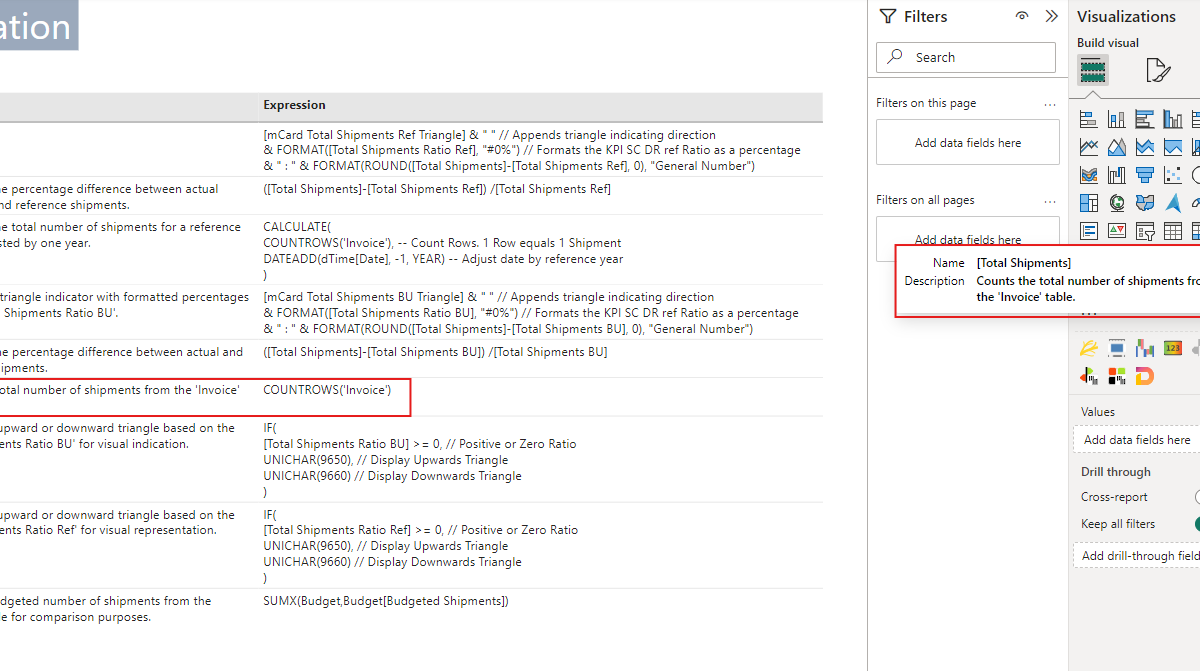
When hovering over measures in the Data pane view, you can see the name and description pop up.

If there is no description, you need to switch to the Modeling view, select the measure, and manually add the description. While this process is straightforward for a few measures, it becomes extremely time-consuming when dealing with larger models. Updating each measure can take several minutes, making it a tedious task that quickly leads to frustration and inefficiency.

Challenges of Manual Power BI DAX Documentation
Documenting DAX measures manually can be frustrating, especially when dealing with hundreds of measures and tables:
- Time-Consuming: Typing descriptions one by one can take hours or even days.
- Error-Prone: Manual entries can lead to inconsistencies or mistakes.
- Inefficient: Your valuable time could be spent on more impactful tasks than repetitive documentation.
Drawback: This method is feasible for a handful of measures but is incredibly inefficient for large-scale projects. It, while simple, becomes extremely time-consuming with larger models, where updating each measure can take several minutes—leading to frustration and inefficiency.
Overview of Tabular Editor 2 as a Data Model Documentation Tool
What is Tabular Editor 2?
Tabular Editor 2 is a free, powerful tool designed for managing Power BI data models. Lightweight yet robust, it offers a range of functionalities that greatly enhance your documentation efforts. With Tabular Editor 2, you can edit measure descriptions, update metadata, and make bulk changes without needing to switch between multiple interfaces—saving significant time and effort.
You can download Tabular Editor 2 here. While there is also Tabular Editor 3, which includes additional advanced features and a more user-friendly interface, it comes at a cost. For most documentation tasks, Tabular Editor 2 is sufficient and perfectly suited since it’s free and provides all the necessary tools.
Installation Tip: Once installed, close Power BI and restart it. You should see Tabular Editor 2 under the External Tools pane in Power BI Desktop, ready to use for your documentation needs.

Benefits of Using Tabular Editor 2 for Power BI Documentation
- Bulk Editing Capabilities: Tabular Editor allows you to update descriptions for multiple measures at once.
- C# Scripting Support: You can write and run C# scripts to automate tasks, making documentation faster and more reliable.
- Seamless Integration: Works directly with Microsoft Power BI documentation processes, enabling you to make changes that are reflected in your Power BI Desktop file.
Step-by-Step Guide to Automate Power BI Documentation Using Tabular Editor 2, C# Scripts, and ChatGPT
Step 1 – Connect Your Power BI Model to Tabular Editor 2
The first step is connecting your Power BI Desktop file to Tabular Editor 2:
- Open your Power BI Desktop file and ensure it is running.
- Launch Tabular Editor 2 and connect it to the active Power BI model.
Tip: Always have your Power BI file open when working with Tabular Editor to prevent connection issues.
Step 2 – Save the Model as a Local BIM File
Once connected, save your model locally as a .bim file:
- In Tabular Editor 2, save the model file as
.bim. - Open the
.bimfile in a text editor (like Notepad) and save it as a.txtfile. This format is more compatible with ChatGPT’s processing capabilities.
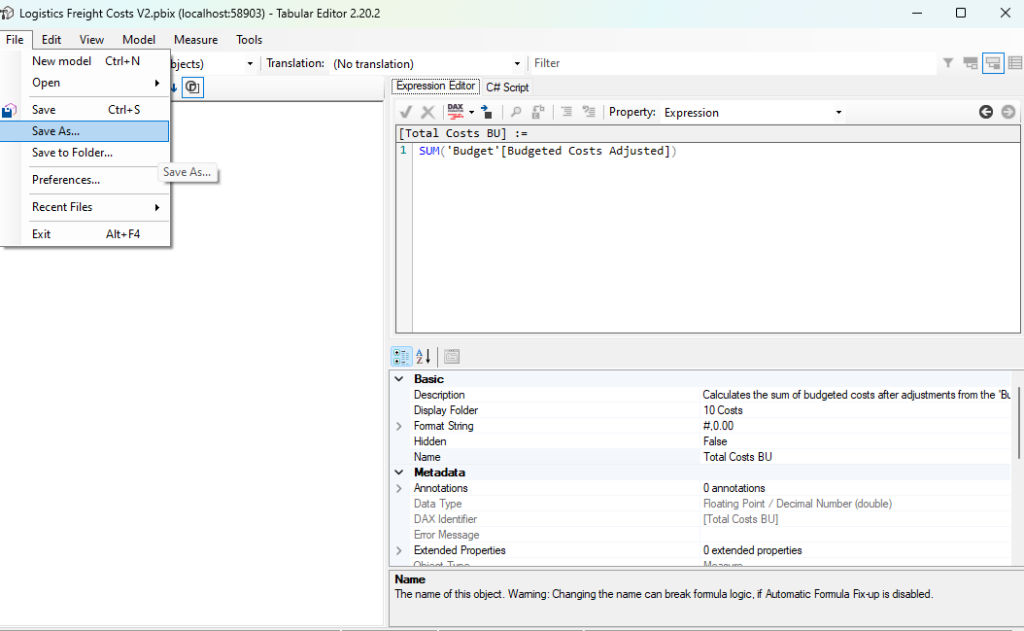
Why this step matters: ChatGPT can better parse the metadata from your Power BI model when it’s in a readable format like .txt.
Step 3 – Upload the Model Metadata to ChatGPT
Upload your .txt file to ChatGPT:
- Use ChatGPT’s file upload functionality to input the file.
- Allow ChatGPT to parse the file, extracting information such as measures, table columns, and relationships.
Example: Once uploaded, ChatGPT can return structured outputs that include all your Power BI documentation elements.
I will provide you with the exact prompt later in this article:
Step 4 – Create a Documentation Table Using DAX
For a comprehensive view of your documentation, create a table within Power BI using DAX:
- Reference Martyn Booth’s blog post on creating an auto-documentation report with DAX (read more here).
- Use the
INFO.VIEW.MEASURES()function to display metadata for your measures.
Note: According to Martyn Booth, this approach has proven to be a huge time saver for Power BI Documentation and was well-received by the Power BI community (see his LinkedIn post).
All you got to do is create a new table and add the following dax code:
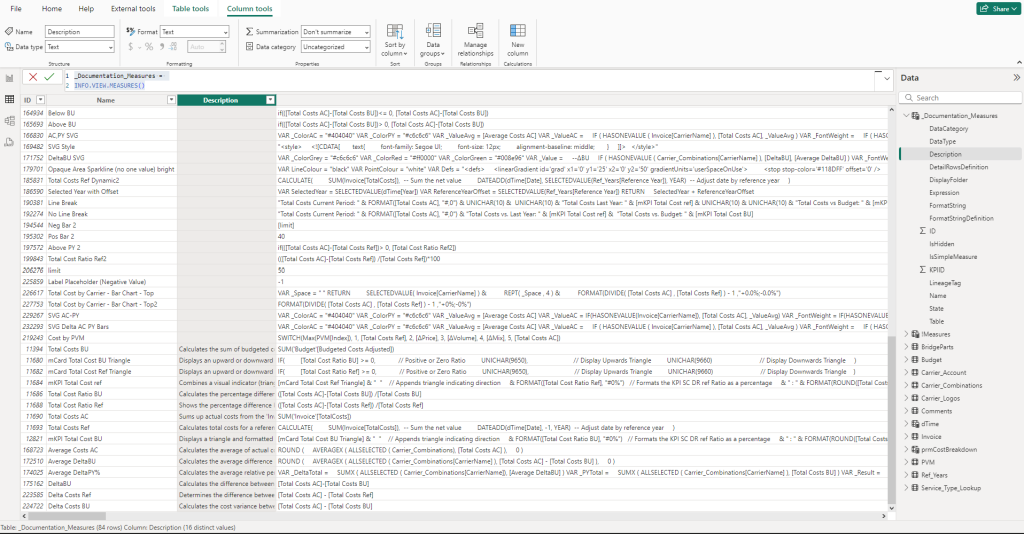
_Documentation_Measures =
INFO.VIEW.MEASURES()
This will create a table like this, including measure names, expressions and other metadata information:
In there, you also see a column Description, which will be relevant for us.
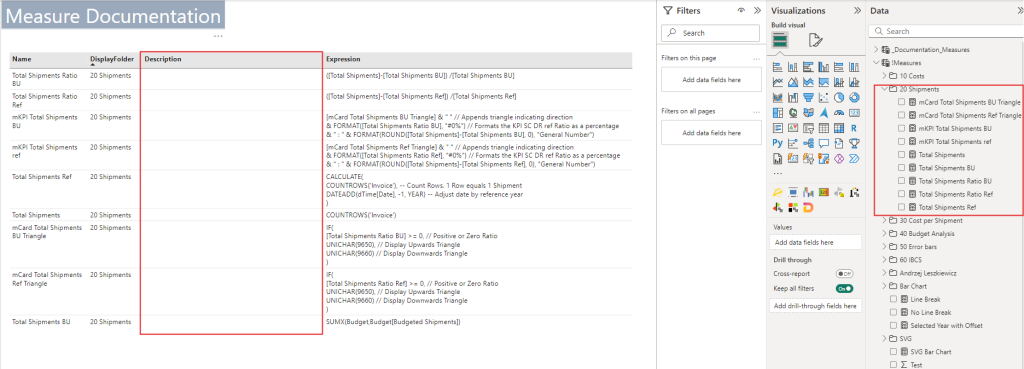
Adding a table visual with Measure Information
For demonstration purposes I have created a new page in Power BI Desktop including the Name, Display Folder, Description and Expression. For now, I filtered only by measure which are in the display folder “20 Shipments”. As you can see, there are no descriptions for any of the measures in there. You can simly re-create that table by importing a simple table visual to the canvas and then take the fields from the new table you just created containing the measure details.
Step 5 – Generate C# Scripts for Measure Descriptions in Tabular Editor
Automate descriptions using C# scripts created with ChatGPT:
- Ask ChatGPT to generate a C# script tailored to your needs.
- Copy and paste the script into Tabular Editor 2 and run it.
Here’s a prompt I used for it. The code worked well but it can require some trial and error until you find the right descriptions:
Here’s a prompt for your blog readers to use in ChatGPT:
Prompt for ChatGPT:
“I have a Power BI data model and need to update the descriptions for all DAX measures in a specific folder using a C# script in Tabular Editor. I want detailed descriptions for each measure, including in-line comments within the DAX code to help new users understand the logic. Can you create a C# script that iterates through the measures, updates the descriptions, and adds relevant DAX comments on the right side of the code? Here’s an example structure for one measure: use the code logic below (sample C# script):
// List of specific measures to update and their descriptions
var measuresToUpdate = new Dictionary<string, string>
{

    { "Inventory Quantity", "Calculates the total inventory quantity at the end of a month, based on the selected 'End of Month' date." },
    { "Δ % Sales PY -1", "Calculates the percentage change in EDI sales from the previous year." },
    { "Sum COGS", "Summarizes the total Cost of Goods Sold (COGS) for QAD, including various external costs." },
    { "PY Measure", "Dynamically switches between sales or quantity for the previous year, based on slicer input." }
   };

// Iterate through each measure and update its description
foreach (var entry in measuresToUpdate)
{
    var measure = Model.AllMeasures.FirstOrDefault(m => m.Name == entry.Key);

    if (measure != null)
    {
        // Log measure being processed for verification
        Console.WriteLine("Processing and updating measure: " + measure.Name);

        // Update the description
        measure.Description = entry.Value;

        // Log success message
        Console.WriteLine("Updated description for: " + measure.Name);
    }
    else
    {
        // Log if the measure is not found
        Console.WriteLine("Measure '" + entry.Key + "' not found.");
    }
}

// Log completion for verification
Console.WriteLine("Script completed.");
Using this C# script, you will be able to add a description to each measure. I suggest to start in increments, such as with one subfolder, and not with all measures at once. This way it becomes manageable.
In Tabular Editor, head over to the C# section and paste this code (of course these are sample measure names from my report, you would need to change them). Afterwards, click on the green run icon. Ideally you don’t see an error. Now, press “CTRL” and “S” to save the changes in tabular editor. As soon as you do that, the descriptions will be added to Power BI Desktop!
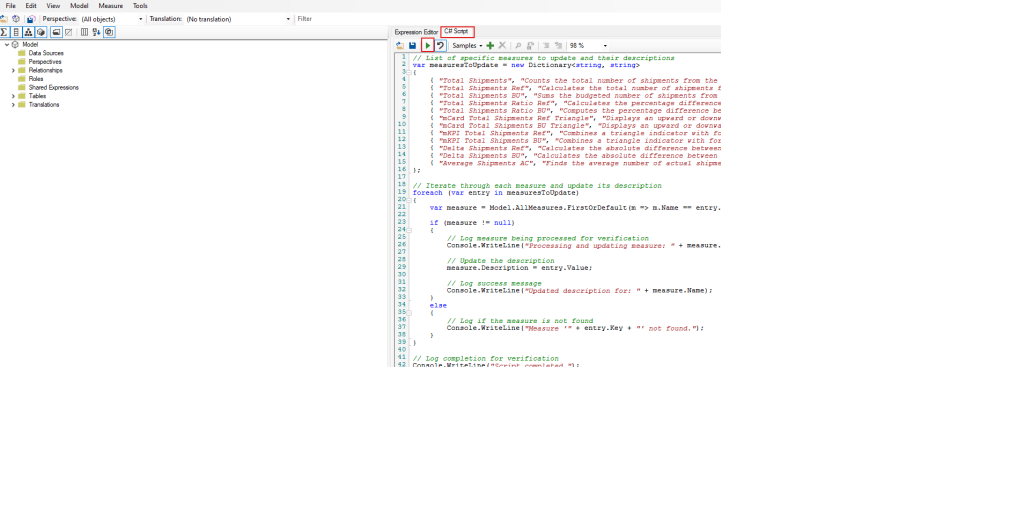
Reminder: Always review these descriptions. ChatGPT’s outputs can sometimes need slight modifications to match your specific context.
Important: Once you update the Tabular Editor, the measures in the Power BI desktop file will be updated with a description! The table created with Info.View.Measures() function may needs to be refreshed! It does not apply the changes automatically. To do that you can replaces the dax code with Info.View.Tables() and then switch back to Info.View.Measures()
Step 6 – Verify and Finalize the Documentation
After running the script, verify the results:
- Check for Accuracy: Ensure that the descriptions make sense and are relevant.
- Edit if Needed: Use Tabular Editor 2 to fine-tune any discrepancies.
Word of Caution: While automation is powerful, human oversight is essential to guarantee quality.
In my case, chat gpt forgot to update just one measure but all other measures now have a description!
As an example: When hovering over the measure “Total Shipments” a description pops up and the Description columns from our table has the same description!
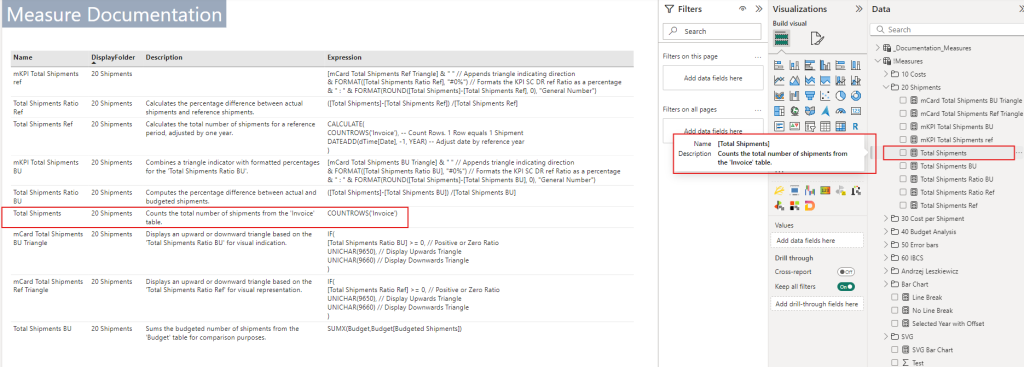
P.S. Of course it is possible and recommend to add descriptions to table columns as well. SImply ask your friend Chat GPT to write you the C#Script for that as well 😉
Why Automated Documentation is Essential
- Time Efficiency: Automating the Power BI documentation process can save countless hours that would otherwise be spent manually updating each measure and column description. This significant time-saving advantage allows developers and data professionals to redirect their focus to more analytical tasks and strategic problem-solving, enhancing the overall value of their work and boosting productivity.
- Consistency: Leveraging automated tools such as Tabular Editor 2 and ChatGPT ensures a consistent approach to updating and managing your data model. Manual documentation often results in inconsistencies or errors due to human oversight, but automation maintains uniformity across all measures and metadata. This consistency is essential for maintaining best practices and helps create a coherent and reliable documentation structure.
- Impact: High-quality and consistent documentation can greatly reduce misunderstandings during project handovers and when new developers join the team. It provides a clear roadmap for understanding the data model, making onboarding faster and more efficient. Well-documented models also facilitate smoother transitions and allow for seamless updates in future development phases, supporting long-term maintainability and collaboration.
Conclusion
Comprehensive Power BI measure description is essential for successful data modeling and long-term project sustainability. By integrating Tabular Editor 2, C# scripting, and ChatGPT, you can transform a manual, time-consuming process into an efficient, automated workflow. This approach not only saves time but also ensures consistency, clarity, and maintainability in your Power BI report documentation.
Automating measure descriptions in Power BI streamlines workflows and minimizes human error, resulting in more uniform documentation. Clear, consistent documentation is invaluable for project handovers, onboarding new team members, and revisiting older models. Implementing these tools enhances collaboration, supports long-term success, and makes your Power BI DAX documentation a reliable asset for future development.
Don’t let your documentation lag behind. Start enhancing your Power BI documentation process today with Tabular Editor 2 and ChatGPT for seamless, automated solutions.
FAQs:
FAQs
Q1: What is the best tool for Power BI DAX documentation?
A: Tabular Editor 2 is highly recommended due to its robust editing and scripting capabilities, along with dax.info functions. It allows users to automate updates to measure descriptions, manage metadata, and streamline the documentation process.
Q2: How does the INFO.VIEW.MEASURES() function help in documentation?
A: The INFO.VIEW.MEASURES() function provides detailed metadata for all measures within your Power BI model. This is essential for creating comprehensive documentation tables and ensuring clarity in your Power BI report documentation.
Q3: Can I use Tabular Editor 2 for free?
A: Yes, Tabular Editor 2 is a free tool that is powerful enough for most documentation tasks. While there is a paid version, Tabular Editor 3, the free version suffices for adding descriptions and managing your data model effectively.
Q4: How do I install Tabular Editor 2 and integrate it with Power BI?
A: You can download Tabular Editor 2 from its official GitHub page. After installation, restart Power BI Desktop, and you should see Tabular Editor 2 in the External Tools pane.
Q5: What are the main differences between Tabular Editor 2 and 3?
A: Tabular Editor 2 is free and supports essential documentation and scripting features. Tabular Editor 3 offers an enhanced user interface, more advanced features, and better support, but it comes with a cost. For basic Power BI documentation needs, Tabular Editor 2 is sufficient.
Q6: How reliable is ChatGPT for generating C# scripts for documentation?
A: ChatGPT can generate reliable C# scripts for updating measure descriptions and automating documentation tasks. However, always review and test the generated scripts, as they might need adjustments for specific use cases.
Q7: What precautions should I take when using ChatGPT for documentation?
A: While ChatGPT is a great tool for automating scripts and generating content, always double-check the output for accuracy. ChatGPT’s suggestions may require some trial and error, so review the content carefully to ensure quality and context relevance.
Looking to improve your Power BI Dashboards? Then I highly recommend checking out my related blog post: 8 Tips To Create An Interactive Dashboard

