Table of contents
Introduction
Sometimes, it makes sense to calculate quarterly average of measure in Power BI instead of looking at raw monthly data. Whether you’re analyzing sales numbers, costs, headcount, or any other metric, a quarterly average provides a clearer view of seasonal patterns and trends.
When I needed to solve this problem, I spent a lot of time searching for the right solution. Many answers online were incomplete or confusing. To save you the same frustration, here’s my step-by-step guide to calculating quarterly averages correctly using DAX and a well-structured Date Table.
Why is Calculating Quarterly Averages Important?
- Helps in tracking trends and seasonality in financial and business performance.
- Provides a smooth and comparative analysis over different quarters.
- Enables better decision-making and forecasting.
Understanding the Data Structure
Importance of a Proper Date Table
A well-structured Date Table is crucial for accurate time-based calculations. The table should include:
- Year, Quarter, and Month Columns to enable period-based calculations.
- A relationship with the Fact Table to ensure correct filtering.
If you don’t already have a Date Table, you can create one dynamically in Power BI using DAX. Check out this guide on creating a dynamic Date Table in Power BI.
Sample Dataset and Structure
In this example, we have:
- A Fact Table containing monthly costs.
- A Date Table that includes Year, Quarter, and Month columns.
- A relationship between the Date Table and Fact Table based on the date field.
Having this structured Date Table is crucial because the DAX measure will rely on quarter-level filtering to correctly aggregate the average values.
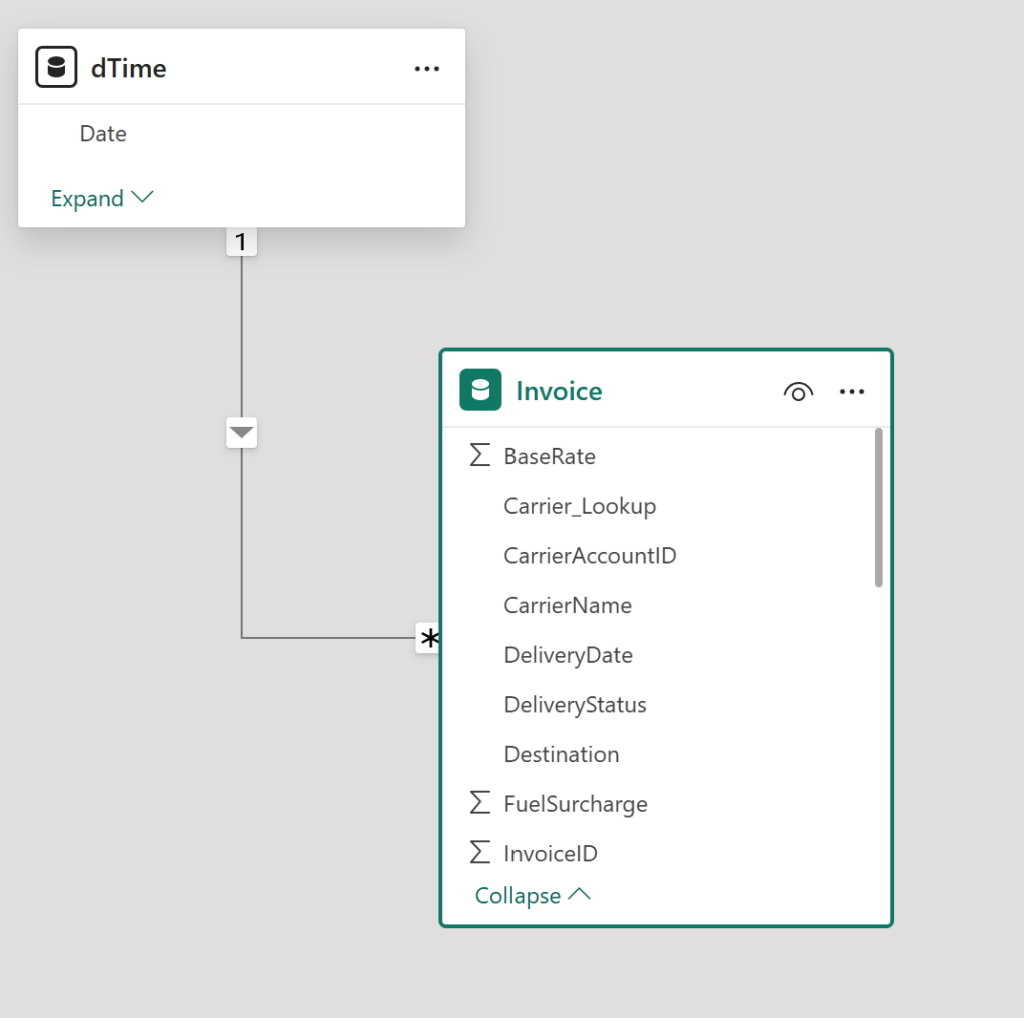
My simple data model below: The dTime table is my date table an the Invoice table is my fact table:
The DAX Solution for Quarterly Averages
Writing the Measure
Use the following DAX measure to calculate quarterly average of measure:
Calculate Quarterly Average =
CALCULATE(
    AVERAGEX(
        VALUES(dTime[YearMonth]), -- Ensures we iterate over the correct months
        [Total Costs AC]
    ),
    ALLEXCEPT(dTime, dTime[YearQuarter], dTime[Year]) -- Keeps only the quarter & year in the filter context
)
How to Adapt This Measure to Your Model
- Modify the Quarter Column: Replace
dTime[YearMonth]with the appropriate quarter column from your date table. - Change the Measure: Replace [Total Costs AC] with the measure you want to average quarterly.
- Ensure the Date Table Relationship Exists: The measure will not work correctly without a proper connection between the Date Table and the Fact Table.
If you’re working with budget data and want to compare actual vs. planned results, see how to compare actual results to budgeted results in Power BI.
Step-by-Step Implementation in Power BI
Step 1 – Creating a Date Table
A Date Table can be created using DAX:
DateTable = ADDCOLUMNS(
    CALENDAR(DATE(2020,1,1), DATE(2030,12,31)),
    "Year", YEAR([Date]),
    "Quarter", FORMAT([Date], "YYYY/Q")
)
Alternatively, an external calendar table can be imported.
Step 2 – Establishing Relationships
- Ensure a one-to-many relationship between the Date Table and the Fact Table.
- The date column in both tables should be correctly formatted.
Step 3 – Writing the Measure in Power BI
- Insert the measure into the Power BI model.
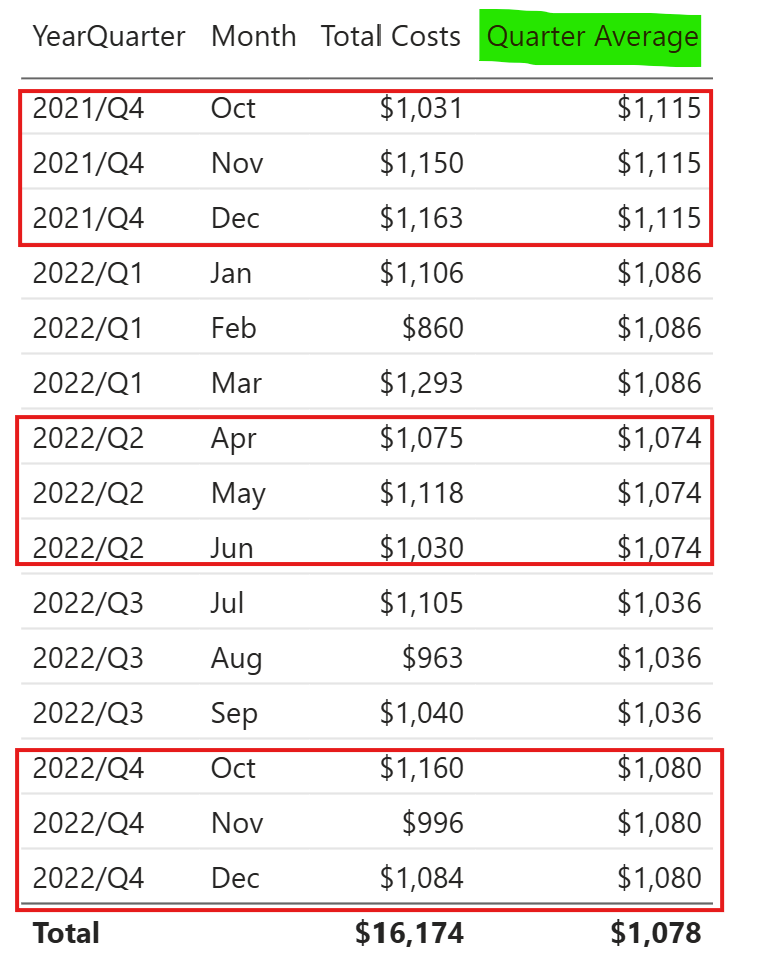
- Validate the results by checking quarter-level data in a table visualization.
For more dynamic date filtering in your Power BI reports, learn how to implement a relative Month-to-Date filter.
Common Mistakes and Troubleshooting
Issue: Incorrect Values in the Quarterly Average
Possible Cause: The Date Table and Fact Table lack a proper relationship.
Fix: Establish a one-to-many relationship using the Date column.
Issue: The Average is Calculated for All Data Instead of Quarterly
Possible Cause: Missing ALLEXCEPT in the measure.
Fix: Ensure the filter context includes Quarter & Year.
Real-World Use Cases
- Financial Reporting: Analyzing expenses and revenue trends per quarter.
- HR Analytics: Calculating average headcount per quarter.
- Sales Analysis: Understanding seasonal sales performance.
FAQ – Frequently Asked Questions
Frequently Asked Questions
What is the purpose of using ALLEXCEPT in this calculation?
ALLEXCEPT ensures that only the Year and Quarter remain in the filter context while removing all other filters, allowing for accurate quarterly averaging.
Can I use this approach for other time periods, like yearly averages?
Yes! You can replace Kalender[Quartal / Jahr] with Kalender[Jahr] to calculate yearly averages instead of quarterly ones.
Why is my measure returning the same value across all months?
Check if the Date Table is correctly linked to the Fact Table and ensure that VALUES(Kalender[Monat / Jahr]) is used correctly in AVERAGEX.
Conclusion
Calculating the quarterly average of a measure help in better trend analysis and decision-making. By using the correct DAX measures and ensuring a proper Date Table setup, Power BI users can gain deeper insights into their data.
If you want to explore more advanced filtering techniques, discover how to implement a relative Month-to-Date filter in Power BI.
Have questions? Share your thoughts in the comments!