Introduction to Dynamic Year Selection
Dynamic Time Intelligence in Power BI transforms how we approach data analysis, offering powerful ways to compare and contrast figures across various timespans. By mastering Power BI Dynamic Year Comparison, analysts can gain deeper insights into trends and patterns that unfold over multiple years, enabling data-driven decision-making that’s both strategic and timely.
Shortcomings of static year comparisons with date add function
As an analyst, I often encounter the challenge of comparing metrics across various time-periods. For reporting purposes, it’s not only useful to select the previous year but sometimes necessary to consider the last two, three, or more years for a clearer analysis and comparison. The question is, how can I effectively implement Power BI Dynamic Year Selection to automatically reflect these changes? The main problem is the static nature of time intelligence measures which, if not set up correctly, can lead to a tedious process of manual year selection every time there is a need to update the comparison periods.
To calculate the previous year sales, I usually turn to the date add function and select a static value of -1 which means to calculate the sum of sales for the previous year.

Here the code if you want to follow. You simply need to replace my table and column name with yours to make it work in your report:
Total Costs Ref =
    CALCULATE(
        SUM(Invoice[TotalCosts]),           -- Sum the total costs
        DATEADD(dTime[Date], -1, YEAR)      -- Adjust date by -1 reference year
    )
Solution
I’ve found that using Dynamic Time Intelligence in Power BI makes things a lot more flexible. My solution is simple: create a “Reference Years” table. This table works perfectly with Power BI Dynamic Year Selection, making it much easier and quicker to compare different years without all the manual work.
Step-by-Step Implementation
Here comes a thorough guides that takes you through the necessary steps:
1) Setting Up for Power BI Dynamic Year Selection
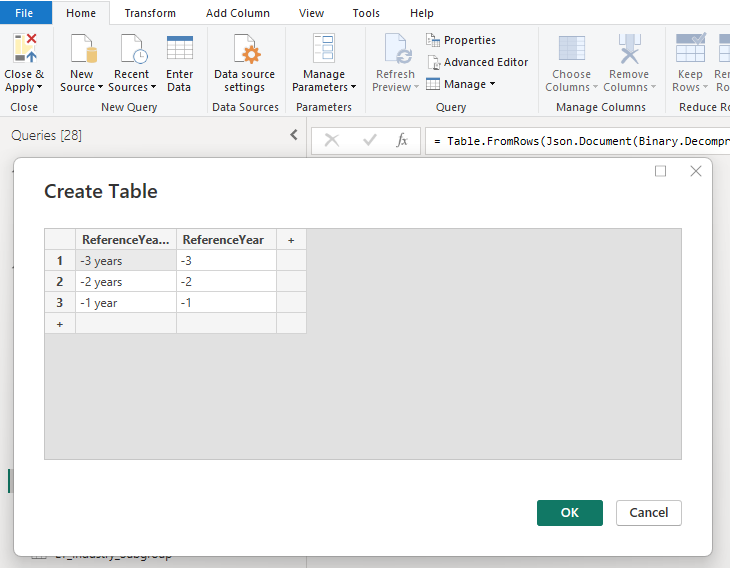
I start by creating a ‘Ref_Years’ table in Power Query. It’s the foundation of my Power BI Dynamic Year Comparison. This table includes values that represent the current year, with offsets for the past years (like -1 for last year, -2 for two years back, and so on).

To create this table, open the Power Query editor, click on the home tab and select “Enter Data”. Then simply type in the values. You can name them slightly different, that is up to you.

2) Applying Dynamic Time Intelligence with DAX:
Below is the DAX formula I use, which really captures what Dynamic Time Intelligence is all about. It makes the Power BI Dynamic Year Comparison adapt to whatever time period I need:

Code below:
Total Costs Ref Dynamic= -- Order Intake referenced period
    CALCULATE(
        SUM(Invoice[TotalCosts]),           -- Sum the net value
        DATEADD(dTime[Date], SELECTEDVALUE(Ref_Years[Reference Year]), YEAR)      -- Adjust date by reference year
    )
Note: There is no need to set up a relationship between the newly created Reference Year Table and your fact table!
The SELECTEDVALUE function is really important here. It’s what makes the Power BI Dynamic Year Selection work smoothly. It automatically picks up the year I’ve selected and uses it, so my Power BI Dynamic Year Comparison is always on point.
3) Applying the filter
Now simply move the reference year column into the page filter or in your report and you can select the different year. Pro tip: Make sure you choose “single select” for the slicer. This ensures you can only select one year!
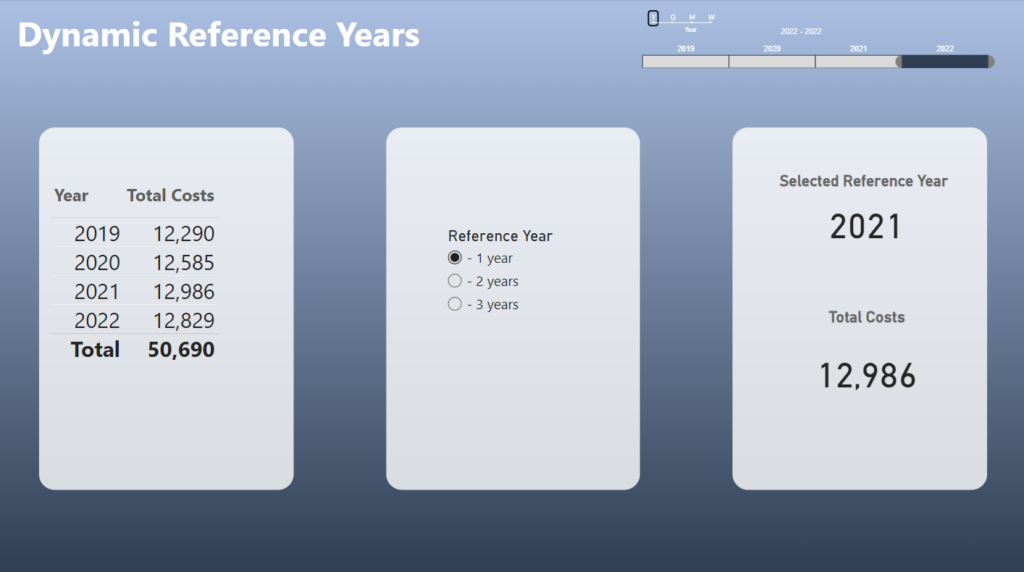
You can see that 2022 is the selected year, based on the time slicer in the top right corner. The table on the left shows the years and costs. In the middle, I inserted the slicer where you can select the desired reference year. The table on the right shows the dynamic cost value and year based on the selected filter criteria.
If you select reference year -1, the data on the bottom right table will show the sales from 2021 which is 12,986. Exactly, the same value as in the left table from 2021.

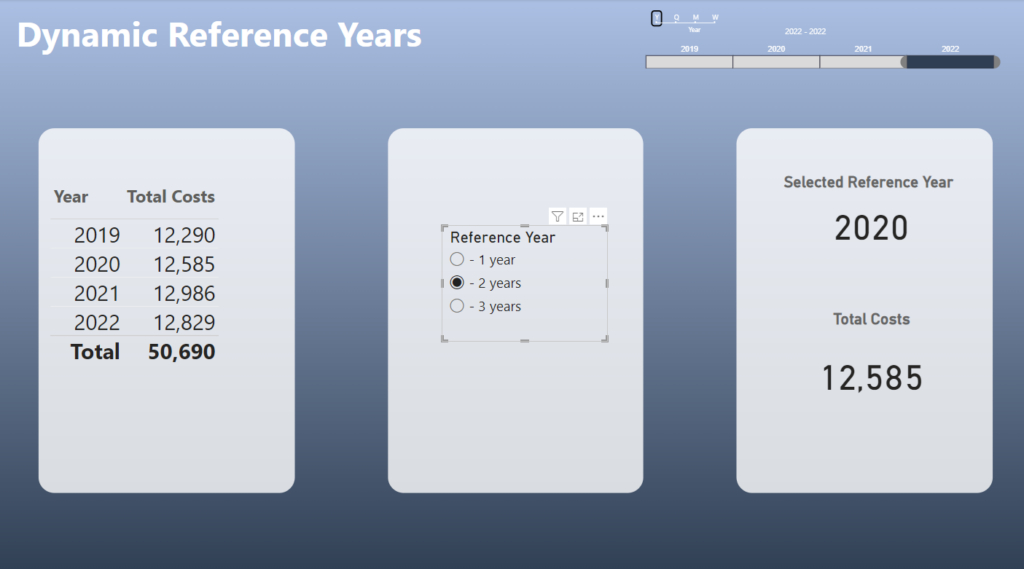
If you select -2 year you will see the sales of 2020 in the bottom right corner. Theorettically you can even select more than 3 years if you add these years in the Ref_Years table. That is up to you. The same logic also works with Month. Simply change “Year” to “Month” at the end of the DAX measure!

Conclusion Power BI Dynamic Year Comparison
In conclusion, mastering Power BI Dynamic Year Comparison and harnessing the potential of Dynamic Time Intelligence empowers analysts to dynamically select and compare data from various years, making reports more adaptable and insightful. Power BI Dynamic Year Selection unlocks the ability to tell richer data stories and make timely data-driven decisions, propelling data analytics to new heights.
If you like this type of series, I would be very happy if you give me a comment, share this post or follow me on LinkedIn.

