Introduction
Power BI has four main views: Report View, Table View, Model View, and the recently added DAX Query View. Among these, the Model View stands out as essential for managing the relationships between your data tables. Whether you’re linking fact tables to lookup tables or setting up calculation groups, the Power BI Data Model View is where it all comes together. In this guide, we’ll walk you through how to use the Model View, explaining its interface and features in straightforward language. By the end, you’ll know exactly how to set up and optimize your data models in Power BI.
Understanding how to navigate the Power BI Model View is crucial for efficient data modeling. The Model View provides a visual representation of your tables and their relationships, allowing you to manage the structure of your data model easily. The simplicity and clarity it offers make it an indispensable tool for anyone working with complex datasets. We’ll cover everything from setting relationships to using advanced features like calculation groups, all in a way that’s easy to understand and apply.
Navigating the Power BI Data Model View
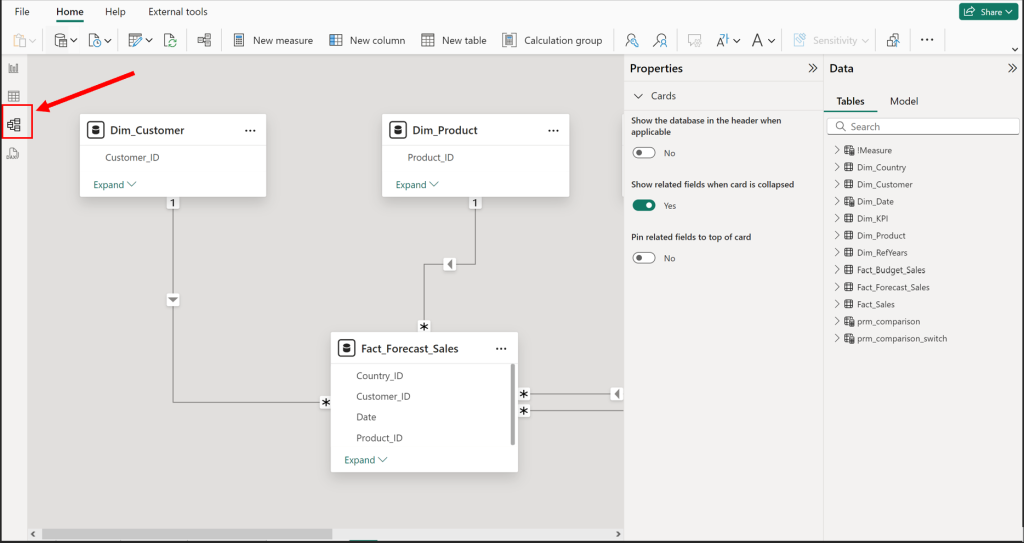
The Model View in Power BI is the go-to place for organizing your data tables and setting up relationships. When you first open the Model View, you’ll notice a clear layout that displays all your tables and their connections. This visual representation makes it easier to see how your data is structured. You can easily switch to the Model View by clicking the “Model” icon in the left-hand pane. Once inside, take a moment to familiarize yourself with the various tools and options available to manage your data model.
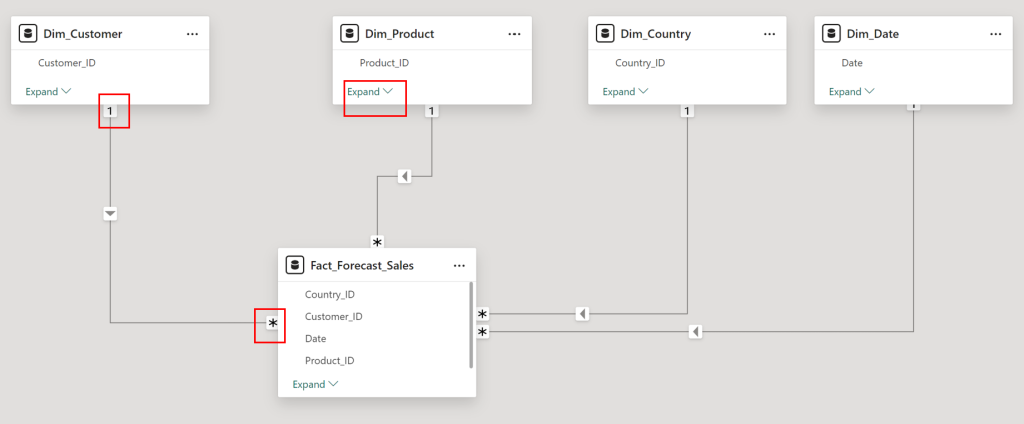
Navigating the Model View is intuitive. The interface is designed to be user-friendly, with all your tables laid out clearly. You can zoom in and out to get a better view of your tables and relationships. The Model View also allows you to expand and collapse tables to focus on specific parts of your model. This level of control makes it easier to handle even the most complex data models, ensuring that you can always keep track of your tables and relationships.
Setting Relationships Between Tables
Relationships in Power BI connect your tables in meaningful ways. In the Model View, you can set up different types of relationships, such as one-to-many or many-to-many. To create a relationship, simply drag a field from one table to a matching field in another table. This is particularly useful for linking fact tables with lookup tables, which helps to streamline your data model. You can also manage existing relationships by clicking on the connection lines between tables and adjusting the settings as needed. To learn more about the data model set up and best practices view my blog post: Data Modeling Power BI: A Comprehensive Guide
Creating and managing relationships effectively is a critical part of data modeling in Power BI. By setting up the right relationships, you ensure that your reports reflect accurate and meaningful data. The Model View makes this process straightforward, with visual cues and easy-to-use tools that guide you through creating the connections between your tables. Managing these relationships properly helps to avoid common pitfalls like circular dependencies and ensures that your data model remains efficient and reliable.
Pro Tip: Use the collapse function in the tables to only show the columns with a relationship, this way you safe a lot of space!
Using the Properties Pane in Model View
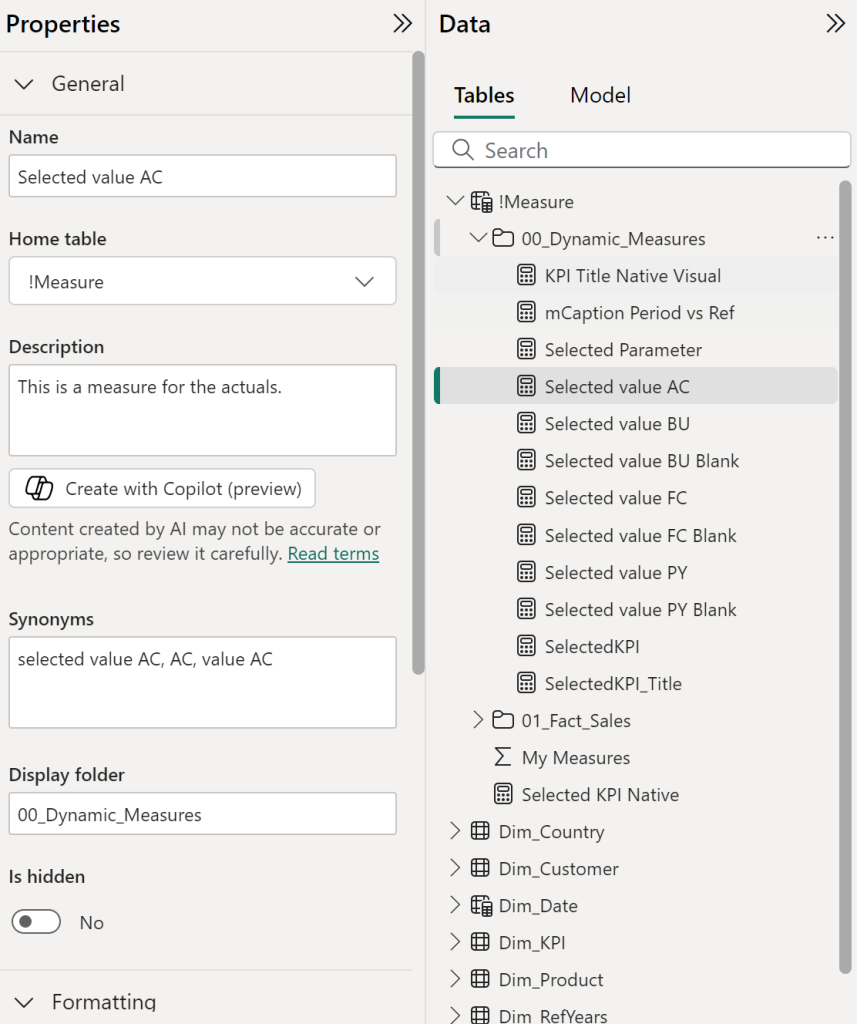
The Properties pane in Model View allows you to fine-tune your tables and columns. By selecting a table or column, you can access various settings in the Properties pane on the right side of the screen. Here, you can rename tables, change column formats, or even hide columns that aren’t needed in your reports. This level of control helps ensure that your data model is clean and well-organized, making it easier to manage and update as your data evolves.
The Properties pane is also where you can add descriptions to your tables and measures. Adding these descriptions is a best practice, especially in larger models where it can be challenging to keep track of what each table or measure does. Descriptions provide context that can be crucial for anyone else working with the model, reducing the risk of errors and misunderstandings. By utilizing the Properties pane effectively, you can maintain a high level of organization and clarity in your data model.
Managing Tables and Calculation Groups
Organizing your tables effectively is key to a well-functioning data model. In Model View, you can see all your tables at a glance and rearrange them to suit your needs. Additionally, you can create calculation groups, which are a powerful way to manage similar calculations across multiple measures. Calculation groups reduce redundancy and make your model more efficient. When used correctly, they can greatly enhance the performance of your reports, making your data analysis more effective and streamlined.
Arranging and managing your measure tables is another best practice in Power BI. By organizing your measures into dedicated tables, you can keep your data model clean and easy to navigate. Grouping related measures together within their own tables simplifies maintenance and updates, contributing to a more streamlined and professional Power BI project. This practice not only improves the overall structure but also enhances the efficiency of your reports, ensuring that your model is intuitive and easy to work with.
Additional Tools and Features in Model View
Model View comes packed with tools to help you manage your data model more efficiently. The Semantic model, for example, offers a structured way to organize your tables, relationships, and measures. The Search function is another handy tool, allowing you to quickly locate specific tables or fields within your model. If you’re dealing with complex calculations, you can also leverage Calculation items to simplify and organize your measures. These features collectively make the Model View a comprehensive tool for data modeling in Power BI.
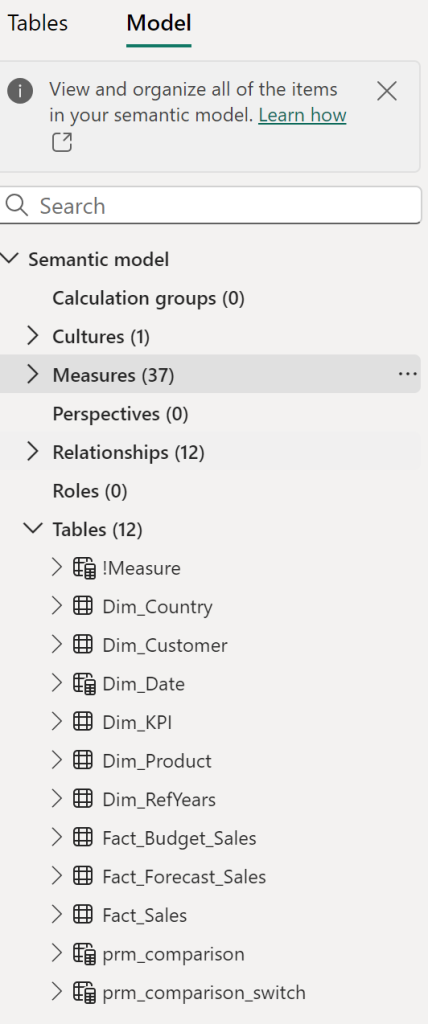
You can also add descriptions to your tables and measures in the Model View, which helps provide context and clarity for anyone else working with the data model. Describing tables can make it easier to understand the purpose of each table, while measure descriptions can clarify what each measure is calculating, ensuring consistent understanding across teams. This feature is particularly useful in large models where numerous tables and measures might be involved. Having these descriptions in place enhances collaboration and reduces the likelihood of confusion or errors when multiple users are interacting with the model.
Conclusion
The Power BI Data Model View is crucial for setting up and managing relationships in your data model. With a clear understanding of the interface and features, you can efficiently organize your tables, set up relationships, and optimize your model for better performance. Take the time to explore each feature, and you’ll find that the Model View is a powerful tool in your Power BI toolkit. Ready to start? Dive into the Model View and begin optimizing your data models today.
By mastering the Model View, you ensure that your Power BI reports are not only accurate but also efficient and easy to maintain. This guide has provided you with the knowledge you need to make the most of this essential feature in Power BI. Whether you’re a beginner or an experienced user, these practices will help you create data models that are both robust and reliable, setting you up for success in all your data-driven projects.

