From messy data to a user friendly data frame.
As a passionate runner I was interested in my running data from runtastic. I am using their service on basically every run so I wanted to get some insights on my performance. So I created this Python EDA Portfolio Project. Here’s how I did it.
Python EDA Portfolio Project: Getting the Data
Obtaining my running data from Runtastic was a crucial first step for this Python EDA Portfolio Project. Getting the data took around 48 hours. If you have a runtastic account, go to their website and use your credentials to log in. Go to your profile settings and request your personal data. Once the data is available for download, you will receive an email. It is not possible to download the data instantly. After the files are available for download, you will receive a ZIP file which you need to unpack containing several folders with lookup values. Since I was only interested in my “sport session” data which includes data about date, distance, pace, or speed.

Python EDA Portfolio Project: Reviewing the Code
In this Python Exploratory Data Analysis Portfolio Project, the coding process was pivotal. It involved:
- Transforming JSON files for better analysis.
- Merging files from folders, crucial for consolidating data.
- Employing datetime intelligence for time-based insights.
- Undertaking comprehensive Exploratory Data Analysis (EDA).
- Data Cleaning, including handling null values and correcting data types.
- Utilizing histograms for understanding data distribution.
- Outlier detection with boxplot and statistical methods.
- Grouping data for deeper insights.
- Creating visualizations with matplotlib & seaborn.
The Importance of EDA
Exploratory Data Analysis, or EDA, is a critical step in the data science process. It allows us to understand the underlying structure and characteristics of our data before jumping into any conclusions or modeling. This understanding is crucial for two main reasons:
- Data Quality Assessment: EDA helps in identifying any issues with data quality, such as missing values, outliers, or incorrect data types, which can significantly impact the results of any further analysis or predictive modeling.
- Insight Generation: Through various visualization and summarization techniques, EDA enables us to uncover patterns, trends, and relationships within the data. For instance, in my project, I used histograms to understand the distribution of run distances and boxplots to identify any outliers in my pace data. These insights can be valuable in tailoring my training and understanding my performance over time.
Transforming and Exploring Data
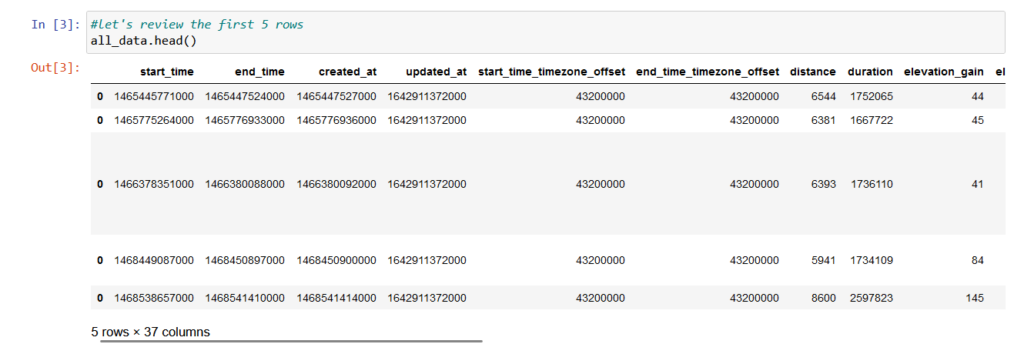
The first step in my Python EDA Portfolio Project was to transform the JSON files from Runtastic into a more analysis-friendly format using Pandas in Python. This involved concatenating data from multiple files and transforming columns to ensure correct data types. For example, timestamps were converted from UNIX time to a human-readable date-time format, making it easier to analyze trends over time.
Next, I cleaned the data by removing unnecessary columns and handling missing values. This step is crucial for accurate analysis, as irrelevant or missing data can lead to incorrect conclusions.
With the data cleaned, I moved on to exploratory analysis. Here, Python’s powerful libraries like Matplotlib and Seaborn came into play, allowing me to visualize the data in various forms. Histograms revealed the distribution of my running distances, while boxplots helped identify outliers in my running pace, which might indicate errors in data recording or exceptional personal performance.
Grouping the data by different periods (like months or years) and other categories provided additional insights into my running habits and performance changes over time. For instance, I could see if my pace improved during certain months or if my running distance varied throughout the year.
Conclusion
In conclusion, EDA using Python provided a comprehensive view of my running data. It transformed raw data into meaningful insights, helping me understand my performance better and make data-driven decisions about my training. This process is a testament to the power of Python in handling and interpreting complex datasets, making it an invaluable tool for any data enthusiast.
Did you enjoy reading the code and my Python EDA Portfolio Project? Reach out to me for personal data analysis projects.

