About the data/ project
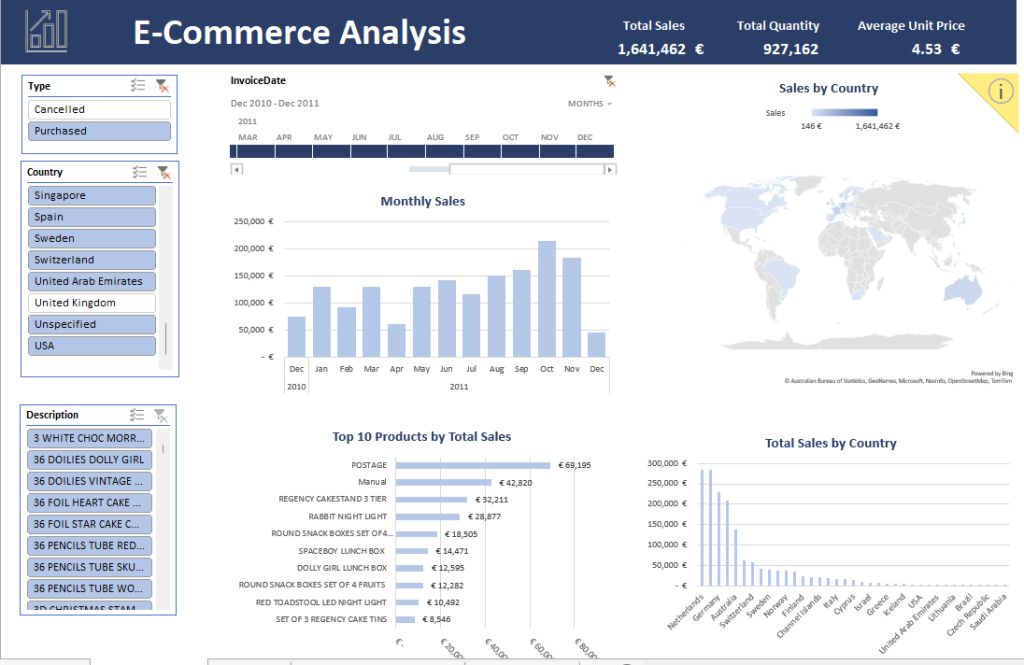
This is a personal project using an E-Commerce Dataset from Datacamp. The data contains sales information from 2010 and 2011 by Country. The goal of this project is to visualize the dataset in so that the data can be explored in an interactive and visually appealing way.
Approach
The source data is a Excel file. Based on this file, multiple pivot table and visuals were created. To make the report interactive, several slicers were added to the dashboard so that the user can drill down by country, by product or by time. The report can be refreshed within one click. It is also possible to combine multiple files from a folder. Once a new file is added to the folder and the user clicks on the refresh button, the new data is automatically added to the report.
Result
The slicer panel on the left allows to filter by Type, Country and Product Description. Plus, it is possible to use the date filter and filter only in the year or month the user is interested in. Once, one of these slicers are changed, all data in the report changes automatically, too. The viusuals are a mix of bar charts (horizontal and vertical) as well as a map which highlights the sales by country based on the amount of sales in each country.

If you like to have access to the report itself, please contact me using the contact form from the footer below.

