
📋 Table of Contents
- What is a Power BI Background Image and Why It Matters
- Power BI Canvas Size and Dimensions: Technical Foundation
- Professional Dashboard Background Design Principles
- Creating Power BI Dashboard Backgrounds: Step-by-Step Guide
- Power BI Backgrounds: Common Pitfalls and Solutions
- Advanced Background Design Techniques
- Templates and Tools for Efficient Dashboard Creation
- Frequently Asked Questions
- Conclusion and Next Steps
After five years as a Power BI developer, dashboard design challenges are real. Starting new projects feels like starting from scratch every time. Creating professional Power BI background images shouldn’t be complicated. Whether you struggle with amateur-looking power bi dashboard backgrounds or spend hours aligning elements manually, there’s a better way. This guide covers everything from canvas settings to design principles. Transform your dashboards into executive-ready presentations with professional dashboard backgrounds.
What is a Power BI Background Image and Why It Matters
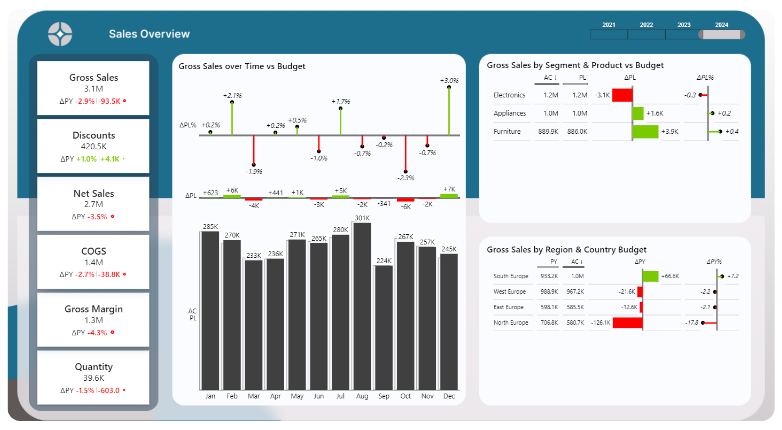
A Power BI background image is your dashboard’s foundation canvas. It sits behind all data visualizations. Background images provide structure, branding, and visual hierarchy. Think of it as a blueprint for visual placement.
Key Benefits of Professional Backgrounds:
- Create sophisticated layouts with headers and sidebars
- Establish designated areas for KPIs and charts
- Guide visual element placement for maximum impact
- Maintain brand consistency across reports
- Improve stakeholder first impressions
Professional dashboard designers prefer canvas backgrounds over other types. They offer complete control over page structure. Canvas backgrounds apply to entire report pages. Wallpapers are more decorative. Visual-specific backgrounds apply only to individual charts.
The business impact extends far beyond aesthetics. Stakeholders judge data quality within seconds of viewing dashboards. Polished backgrounds establish immediate credibility. Properly structured backgrounds guide viewers through data stories. This reduces cognitive load and improves decision-making speed.
Business Impact Results: Organizations with professional dashboard backgrounds report 40% faster approval cycles, 60% increased stakeholder engagement, and 35% higher BI adoption rates.
Power BI Canvas Size and Dimensions: Technical Foundation
Understanding canvas dimensions is fundamental for effective power bi background images. Canvas size directly impacts performance and user experience. The right dimensions ensure consistent display across devices.
Standard Canvas Dimensions and Their Implications
Power BI’s default canvas is 1280×720 pixels (16:9 aspect ratio). This ensures compatibility with most viewing scenarios. However, 720p resolution feels cramped for complex dashboards. The 16:9 ratio mimics modern widescreen displays.
Professional developers upgrade to enhanced dimensions. Popular choices include 1664×936 pixels (30% increase) or full HD 1920×1080. Larger canvases provide more space for detailed visualizations. They allow better spacing between elements. Exported materials look sharper and more professional.
Performance Trade-offs: Larger canvases impact loading times and memory usage. Test with older devices and slower connections before finalizing dimensions.
How to Set Canvas Width and Height in Power BI
Setting canvas dimensions requires attention to technical and business requirements. Here’s the step-by-step process:
Canvas Setup Process:
- Navigate to Format pane in Power BI Desktop
- Select Page Information from dropdown menu
- Choose Canvas Settings option
- Select predefined ratios (16:9, 4:3) or Custom
- Specify exact pixel dimensions for custom sizes
Consider your target viewing environment carefully. Large monitors need bigger canvas sizes like 1920×1080. Conference room projections benefit from custom ultrawide formats. Tablet-friendly dashboards work best at 1280×720 or modest increases.
| Canvas Size | Dimensions (W×H) | Best Use Case | Performance | Compatibility |
|---|---|---|---|---|
| Default 16:9 | 1280×720 | General purpose, mobile-friendly | Excellent | Universal |
| Enhanced 16:9 | 1664×936 | Professional dashboards | Good | Modern devices |
| Full HD | 1920×1080 | Executive reports | Moderate | Desktop focus |
| Custom 4:3 | 1440×1080 | Portrait layouts, printing | Good | Presentation-focused |
| Ultra-wide | 2560×1080 | Wall displays | Lower | Specialized displays |
Professional Dashboard Background Design Principles
Creating professional dashboard backgrounds requires understanding fundamental design principles. Professional backgrounds enhance data comprehension without overwhelming users. They establish hierarchy, guide attention flow, and reinforce brand identity.
Visual Hierarchy and Layout Structure
Effective visual hierarchy follows natural reading patterns. Western cultures use Z-pattern scanning (top-left to bottom-right). Place critical KPIs in the top-left quadrant. Secondary metrics flow across the top section.
Visual Hierarchy Best Practices:
- Header sections occupy 10-15% of total canvas height
- KPI areas use consistent sizing and spacing
- Content zones have sufficient white space
- Clear boundaries prevent visual bleeding between sections
- Supporting details positioned in lower dashboard areas
Professional backgrounds create distinct content zones. Subtle visual cues separate different information types. Header sections should be prominent but not dominant. KPI sections benefit from evenly distributed cards or tiles.
Color Psychology and Brand Integration
Color selection balances brand consistency with data visualization best practices. Corporate colors should enhance rather than compete with data stories. Professional backgrounds use neutral or muted brand colors.
Reserve fully saturated brand colors for accents and highlights. This maintains brand recognition while keeping data as the primary focus. Contrast ratios become critical for text readability and chart visibility.
Accessibility Standards: Follow WCAG guidelines with 4.5:1 contrast ratios for text and 3:1 for larger elements. Background intensity should never compete with data visualizations.
Typography and Spacing Standards
Typography hierarchy establishes clear information architecture. Header text should be prominently sized and weighted. Use organization brand fonts at 24-32px for main titles. Section headers work best at 18-24px.
Spacing standards follow mathematical progressions for visual harmony. The 8-point grid system aligns all spacing to multiples of 8 pixels. Alternatively, golden ratio (1:1.618) guides section relationships. Consistent spacing improves technical implementation and visual alignment.
Typography Scale Guidelines:
- Main titles: 24-32px with organization brand font
- Section headers: 18-24px maintaining font consistency
- Subtitles: Step down proportionally for clear distinction
- Body text: Maintain consistent font families throughout
- Spacing: Use 8-point grid or golden ratio relationships
Creating Power BI Dashboard Backgrounds: Step-by-Step Guide
Creating effective power bi dashboard backgrounds involves multiple approaches. Each method has distinct advantages depending on skills and requirements. Understanding different creation methods helps you choose the right workflow.
Method 1: Manual Drag‑and‑Drop on the Power BI Canvas
The most basic route is to build layout chrome directly on the canvas with Shapes, Text boxes, lines, and colored rectangles. You drag elements into place, eyeball spacing, and stack items until it “looks right.” While this feels flexible, it’s also the slowest and most fragile option.
Typical Manual Canvas Process:
- Insert shapes/text boxes for header, KPI strip, and content panels
- Manually align and nudge positions using the grid and snap‑to features
- Pick colors from memory or a theme, then try to match across pages
- Repeat on every report page to keep things consistent
Manual Drag-and-Drop Disadvantages:
- ❌ Time sink: Spacing, alignment, and color matching consume hours per page.
- ❌ Inconsistent look: Small nudges accumulate; pages drift from your intended style.
- ❌ Performance hit: Each shape/text box is another visual. More visuals can slow rendering and interaction at scale. A single power bi background image replaces dozens of shape visuals, reducing overhead.
- ❌ Hard to maintain: Duplicating or adjusting elements across pages often introduces errors.
Bottom line: manual drag‑and‑drop is fine for quick experiments, but for production work it’s slower, harder to standardize, and can degrade performance. Using a single, optimized power bi background image (PNG/JPG/SVG) gives you a fixed, aligned canvas so visuals drop into place—faster build time, fewer objects, cleaner results.
Method 2: PowerPoint Background Creation
Microsoft PowerPoint remains the most accessible background creation tool. It’s perfect for users needing quick results without specialized software. Set up new slides with custom dimensions matching your Power BI canvas.
PowerPoint Background Process:
- Create a new slide with custom dimensions (e.g., 1920×1080 px or 1280×720 px)
- Use rectangles (rounded corners optional) for header, KPI areas, and content zones
- Apply low‑opacity fills to de‑emphasize background chrome
- Align elements using PowerPoint’s alignment/distribution tools
- Export as PNG at exact canvas size for a crisp power bi background image
PowerPoint excels at structured layouts using simple shapes and text boxes. Create header areas, KPI placeholders, and content sections with rectangles. Import organization color palettes and fonts for brand consistency. Export using “Save as Pictures” (PNG). Match your report page size exactly to avoid blur or pixelation.
PowerPoint Advantages:
- Familiar interface: Easy to use for most business users.
- Built-in alignment tools: Quick spacing and positioning with guides and grids.
- Brand integration: Simple to apply corporate colors and fonts.
- Precise dimensions: Control over exact sizes for Power BI backgrounds.
- No extra licensing: Included in Microsoft Office, no additional cost.
PowerPoint Disadvantages:
- ❌ Not flexible for brand changes: If corporate colors or design tokens update, every slide background must be re-exported. Tools like Figma handle global updates far better.
- ❌ Canvas size dependency: If your Power BI canvas dimensions change, you must rebuild from scratch — resizing often breaks alignment.
- ❌ Manual alignment burden: Even with guides, spacing and consistency start again at zero for each project.
Method 3: Using Professional Design Tools
Professional design platforms offer sophisticated capabilities for custom backgrounds. Canva, Figma, and Adobe Creative Suite provide advanced visual effects and precise typography. These tools shine when you need pixel‑perfect brand execution and reusable components for a truly professional dashboard background.
Canva’s dashboard templates are a quick starting point—search for “dashboard background” or “business report,” then customize colors, fonts, and layouts to match your identity. Figma is ideal for component‑based systems: build reusable background components, enforce a grid, and keep spacing tokens consistent across pages. Collaboration features make team workflows easy.
Figma Advantages:
- Flexible color & theme updates: Change a color token once, and it updates across all layouts.
- Component-based design: Reuse headers, KPI strips, and grids for consistency.
- Collaboration friendly: Multiple BI developers and designers can co-edit in real time.
- Pixel precision: Perfect control over spacing, alignment, and typography.
Figma Disadvantages:
- ❌ Steep learning curve: Requires design knowledge — not as beginner-friendly as PowerPoint.
- ❌ Manual spacing setup: Even with grids, you must calculate margins and layout rhythm yourself.
- ❌ Slower for simple needs: Overkill if you just need a fast dashboard background image for Power BI.
- ❌ Licensing cost: Full features often require a paid plan, unlike free PowerPoint access many companies already have.
Method 4: Automated Background Generators
Automated generators are the fastest way to create a power bi dashboard background. They provide curated presets (header + sidebar, KPI strip + grid, executive summary, long‑form sections), brand color controls, spacing scales, and exact‑size exports (PNG/JPG/SVG). Because the output is a single image, you reduce the number of visuals on the report page, which can improve responsiveness versus dozens of shapes.
Choose a layout, set spacing, apply brand colors, and download a production‑ready power bi background image. This approach standardizes look and feel across pages and projects, while keeping build times short.
Automated Background Generator Advantages:
- Speed: Create professional Power BI backgrounds in minutes instead of hours.
- Pre-built layouts: Choose from curated presets (headers, sidebars, KPI strips, grids).
- Brand ready: Apply your corporate colors and fonts instantly across all pages.
- Pixel perfect: Export exact-fit images (PNG, JPG, SVG) that match your canvas size.
- Consistency: Standardize layouts across projects, ensuring professional uniformity.
- Performance boost: A single background image reduces the number of visuals, improving responsiveness.
- No design skills required: Anyone can produce high-quality layouts without Figma/PowerPoint expertise.
- Cost-effective: Save design hours and avoid licensing fees for heavy tools.
- Scalable: Generate multiple pages or template variations quickly for large BI projects.
- Future-proof: Flexible enough to adapt to new layouts, devices, or brand guidelines with minimal effort.
✨ Something New is Coming
We’re building a tool to create pixel-perfect Power BI background images — launching September 2025.
- ✓ Professional dashboard backgrounds
- ✓ Brand-ready layouts
- ✓ One-click exports
Power BI Backgrounds: Common Pitfalls and Solutions
Even experienced developers encounter challenges implementing power bi backgrounds. Understanding common pitfalls saves hours of troubleshooting. Prevention is better than fixing problems later.
Technical Issues and Fixes
Image resolution problems are the most frequent technical challenge. Mismatched dimensions between backgrounds and canvas settings cause issues. Power BI automatically scales incompatible images.
Automatic scaling introduces blur, pixelation, or unwanted cropping. Your careful design alignment gets destroyed in the process. The solution requires precise coordination between tools.
Resolution Fix Checklist:
- Match background dimensions exactly to Power BI canvas
- Create backgrounds at 100% scale (no auto-scaling)
- Use PNG format for transparency and gradients
- Avoid JPEG compression artifacts with overlaid visuals
- Test backgrounds with actual Power BI visuals
Performance issues impact dashboard loading times significantly. Backgrounds over 2-3 MB cause noticeable delays. Images over 5 MB may trigger timeout errors.
Optimize file sizes by reducing unnecessary detail areas. Use appropriate compression settings. Avoid high-resolution photos that don’t serve functional purposes.
Design Mistakes That Kill Dashboards
Over-designed backgrounds represent the most common mistake. Background elements competing with data visualizations confuse users. Professional backgrounds enhance comprehension, not distract from it.
Poor contrast choices create accessibility problems. Dark text on dark backgrounds becomes unreadable. Insufficient contrast between elements makes dashboards difficult to use.
Design Quality Checklist:
- Test contrast ratios with accessibility tools
- Preview backgrounds with actual data overlays
- Avoid busy patterns and high-contrast decorations
- Maintain consistent spacing throughout design
- Ensure alignment with Power BI’s snap-to-grid
Advanced Background Design Techniques
Advanced power bi background image techniques separate professional implementations from basic reports. These approaches enhance user experience while maintaining technical performance. They require deeper understanding of design theory.
Multi-Page Consistency Strategies
Visual consistency across multiple pages requires systematic approaches. Professional implementations create background template families. Common elements remain consistent while content areas vary.
Template inheritance systems work well for large projects. Establish master templates defining standard elements like headers and footers. Create child templates customizing content areas for specific scenarios.
Template Family Strategy:
- Create master template with standard brand elements
- Define flexible content zones for different chart types
- Develop child templates for specific analytical focuses
- Maintain header and navigation consistency
- Allow content area customization per page requirements
Interactive Background Elements
Power BI backgrounds are static images but can appear interactive. Coordinate background elements with Power BI’s built-in features. Use bookmarks and conditional formatting creatively.
Responsive design principles become important for diverse viewing contexts. Advanced backgrounds incorporate flexible spacing zones. Scalable elements adapt to different aspect ratios.
Templates and Tools for Efficient Dashboard Creation
The dashboard background creation tool landscape continues evolving. Understanding different approaches helps select appropriate tools. Consider skill level, requirements, and organizational constraints.
Free vs. Paid Template Libraries
Free template resources provide valuable starting points. Canva, Unsplash, and Power BI community sites offer basic templates. However, free resources often lack sophisticated BI layouts.
Professional template libraries offer more sophisticated layouts. They understand dashboard design requirements better. Premium resources include multiple variations and color schemes.
| Solution Type | Time Investment | Skill Required | Customization | Consistency | Cost |
|---|---|---|---|---|---|
| PowerPoint DIY | 2-4 hours | Basic | High | Variable | Free |
| Design Tools | 3-6 hours | Advanced | Complete | Excellent | $20-100/month |
| Free Templates | 1-2 hours | Basic | Limited | Poor | Free |
| Premium Templates | 30-60 minutes | Basic | Moderate | Good | $50-200/year |
| Background Generators | 5-15 minutes | None | High | Excellent | Pay-per-use |
Background Generator Solutions
Specialized generator platforms represent the most efficient approach. They combine design expertise with technical precision. Production-ready results take minutes instead of hours.
Modern generators offer sophisticated customization rivaling custom design work. Select curated presets, customize brands, and preview with sample charts. Output includes multiple formats and resolutions.
Efficiency Tip: Combine multiple methods for best results. Use generators for standard layouts and quick iterations. Customize with professional tools for unique requirements.
Frequently Asked Questions
What’s the ideal canvas size for Power BI dashboards?
For general business use, 1664×936 pixels provides the best balance. This is 30% larger than default with 16:9 ratio. Executive dashboards benefit from full HD 1920×1080. Mobile-first dashboards should stick to default 1280×720. Always test performance with target hardware.
How do I prevent backgrounds from affecting performance?
Keep file sizes under 3 MB through image optimization. Use PNG for transparency, JPEG for photos without transparency. Avoid complex gradients in areas covered by visuals. Test loading times with actual user internet speeds.
Should I use same backgrounds across all pages?
Consistency matters, but exact duplication isn’t optimal. Use consistent headers, navigation, and brand elements. Adapt content areas to match specific analytical focus. Create template families maintaining brand coherence.
What file format works best for Power BI backgrounds?
PNG format is ideal for most backgrounds. It supports transparency and maintains crisp edges. No compression artifacts appear with overlaid visuals. Use JPEG only for photographic backgrounds without transparency needs.
How do I ensure backgrounds work on different screens?
Design with flexible spacing zones accommodating different aspect ratios. Avoid critical elements too close to canvas edges. Test at different Power BI display settings. Consider responsive variants for significantly different sizes.
Can I use animations in Power BI backgrounds?
Power BI backgrounds are static images without animation support. Create interactive impressions through Power BI’s built-in features. Use bookmarks, conditional formatting, and slicer-driven navigation creatively.
Conclusion and Next Steps
Creating professional Power BI background images transforms dashboards into compelling presentations. This guide covered technical foundations, design principles, and practical workflows. Professional backgrounds command attention and drive decision-making.
Success lies in balancing aesthetic appeal with functional performance. Designs should enhance data comprehension, not compete with it. Whether using manual creation, templates, or automated generators, fundamental principles remain constant.
Key Success Factors:
- Maintain brand consistency across all dashboard pages
- Optimize for target viewing environments and devices
- Always prioritize data clarity over decorative elements
- Test performance with actual user hardware and connections
- Implement systematic approaches for team consistency
Professional background design pays dividends through faster stakeholder adoption. Reduced revision cycles and increased confidence follow naturally. Investment in design quality contributes to better business outcomes.
Explore Power BI dashboard design ideas to complement your background expertise. Understanding Power BI best practices helps implement techniques within broader workflows. Learn about Power BI color themes for effective color psychology. Review executive dashboard features for context understanding.
🚀 Something Big is Coming for Power BI
Our Power BI background image creator tool is still being crafted — designed to take the pain out of dashboard layout and design.
Launch expected September 2025! Be the first to experience faster, cleaner, and more consistent Power BI dashboard backgrounds.
- ✓ Create professional dashboard backgrounds in minutes
- ✓ Ensure consistent branding across all Power BI reports
- ✓ Export exact-fit layouts (PNG, JPG, SVG)
- ✓ Skip Figma/PowerPoint headaches
Stay tuned — the countdown to launch has begun. You don’t want to miss it!