
Power Query sort by multiple columns is the foundation of clean, predictable data preparation in Power BI and Excel. Specifically, you can Power Query sort multiple columns using either the Editor or the Table.Sort M function. As a result, your data lands in the model exactly the order your reports need. Below, you will find six methods, copy-paste M code, and the trade-offs that matter on real datasets.
Furthermore, the same techniques apply across Power BI Desktop, Excel Power Query, Dataflows, and Microsoft Fabric. Accordingly, this guide focuses on patterns that hold up everywhere — custom orders, sort-within-group, and the trick for forcing nulls last.
- Specifically,
Table.Sortis the canonical way to Power Query sort multiple columns. It accepts a list of column-and-direction pairs. - However, clicking headers in the Editor adds only one sort step at a time. As a result, that path is slower and harder to maintain than writing M directly.
- For example, mixed orders such as Category ascending and Sales descending are written as
{{"Category", Order.Ascending}, {"Sales", Order.Descending}}. - Moreover, custom sort orders (priority lists, business hierarchies) need a helper
List.PositionOfcolumn rather than a literal sort. - Additionally, sorting in Power Query carries into the Power BI data model. However, the table visual will re-sort on header click unless you set a Sort By Column.
Why sorting multiple columns in Power Query matters
Power Query sort multiple columns work belongs at the source — inside Power Query, before the data hits the Power BI model. Specifically, this gives you deterministic ordering, faster downstream refreshes, and predictable behaviour for index columns, running totals, and “first / last value per group” patterns. In other words, sort once in M and never argue with the visual layer again.
“Sorting in Power Query isn’t cosmetic — it is the prerequisite for every M pattern that depends on row order: grouping, indexing, running totals, and ‘pick the latest record per key’.”
Specifically, sorting at the Power Query layer enables four downstream wins. Indexes line up with business logic. Group By steps pick the correct row per key. Running calculations flow in date order. Table visuals load already-ordered, so users see the right row first. Furthermore, doing this work in M means it survives every refresh — unlike clicks in the Power BI table visual, which only affect that single visual.
Power Query sort multiple columns: 6 methods at a glance
Below is the full menu. Specifically, each method targets a different scenario — from a quick UI click for ad-hoc work to advanced patterns that handle nulls, groups, and custom priority lists.
Methods comparison table
| Method | Best for | M function used |
|---|---|---|
| 1. Editor (UI) | Quick exploration. However, not ideal for production. | Table.Sort (auto-generated) |
| 2. Table.Sort M code | Production refreshes. Specifically, multi-column sort in one step. | Table.Sort |
| 3. Mixed asc + desc | Reports such as “Category A–Z, Sales high to low”. | Table.Sort with Order.Descending |
| 4. Custom list order | Business priorities. For example, region order or weekday order. | List.PositionOf + Table.Sort |
| 5. Sort within Group | Latest record per key, top-N per category. | Table.Group + nested Table.Sort |
| 6. Nulls last | Forms data, partial records, optional fields. | Custom comparer in Table.Sort |
Method 1: Sort with the Power Query Editor (UI)
The Power Query Editor offers the fastest path for sorting power query data when you are exploring a dataset. However, it generates one sort step per column you click, which becomes hard to maintain at scale. As a result, this method is best for ad-hoc analysis — not production models.
Step-by-step in the Editor
- Open the query in the Power Query Editor inside Power BI Desktop or Excel.
- Click the dropdown arrow on the column you want to sort first. Specifically, choose Sort Ascending or Sort Descending.
- Repeat on the second column. Furthermore, the order in which you click the columns becomes the sort priority — first click is primary, second click is secondary.
- Open the Advanced Editor to confirm Power Query has merged your clicks into a single
Table.Sortstep.
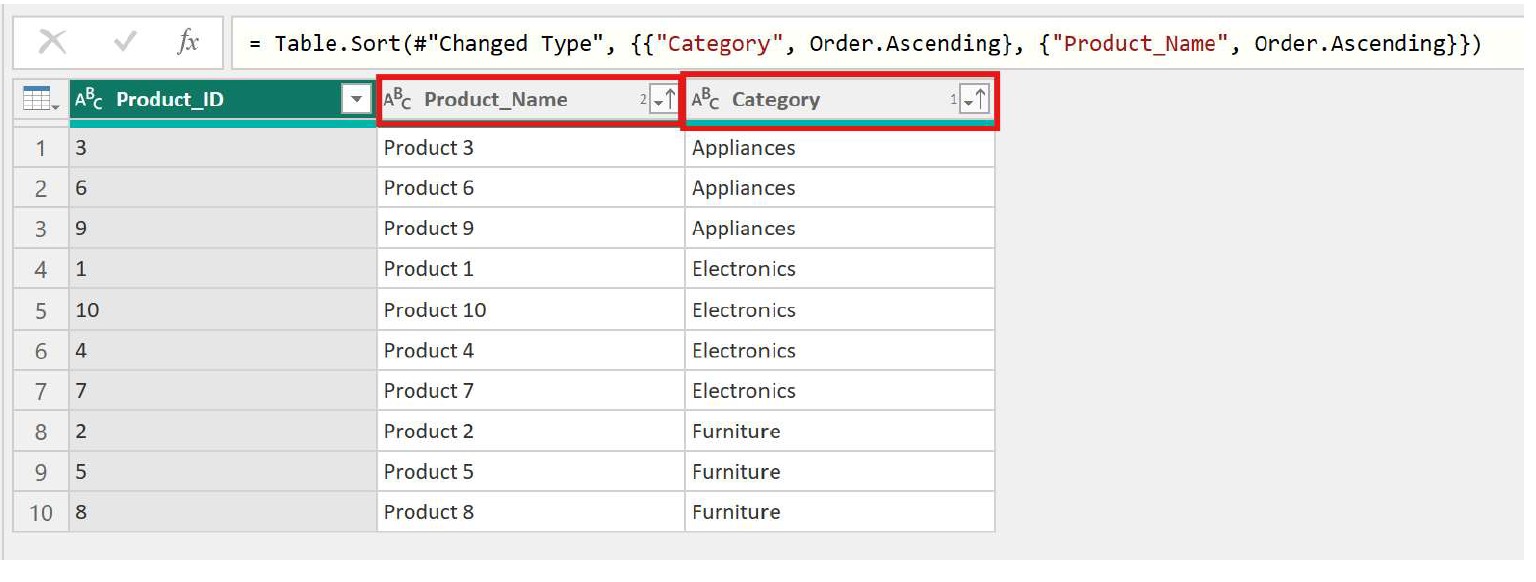
For example, sorting first by Category then by Product Name in the Editor produces this M step automatically:
= Table.Sort(#"Changed Type", {{"Category", Order.Ascending}, {"Product_Name", Order.Ascending}})
Indeed, the same syntax applies in Excel Power Query, Power BI Dataflows, and Microsoft Fabric. Likewise, the Editor’s behaviour is identical across all four products.
Method 2: Power Query sort multiple columns with Table.Sort M code
The cleanest, most reusable way to Power Query sort multiple columns is to write Table.Sort directly in the Advanced Editor. Specifically, this single M function handles two columns, ten columns, mixed orders, and custom comparers — all in one step.
Table.Sort definition
Table.Sort — A Power Query M function that returns a table sorted using one or more comparison criteria. Specifically, it accepts a table and either a single column name, a list of column names, or a list of {column, order} pairs. As a result, you can sort by two columns or many in a single step. The official syntax is documented on Microsoft Learn — Table.Sort.
Table.Sort syntax
Table.Sort(
    table as table,
    comparisonCriteria as any
) as table
Specifically, the comparisonCriteria argument is the part most practitioners get wrong. Furthermore, it can be one of three shapes — a column name, a list of names, or a list of {column, order} tuples. Below is the canonical multi-column form.
Multi-column example (two columns ascending)
let
    Source = Excel.CurrentWorkbook(){[Name="SalesData"]}[Content],
    #"Changed Type" = Table.TransformColumnTypes(Source, {
        {"Category", type text}, {"Product_Name", type text}, {"Sales", type number}
    }),
    #"Sorted Rows" = Table.Sort(#"Changed Type", {
        {"Category", Order.Ascending},
        {"Product_Name", Order.Ascending}
    })
in
    #"Sorted Rows"
Indeed, that single step replaces three or four UI clicks. Moreover, it survives column renames cleanly because the column names are referenced by string — not by index. For more on robust M patterns that survive schema changes, see my guide on fixing the dataflow “field access” error.
Method 3: Mix ascending and descending in one sort
Mixing ascending and descending orders in the same sort is a frequent real-world need — for example, “Category A–Z, but Sales high to low within each category”. Specifically, you simply pair each column with its own Order constant inside the comparisonCriteria list.
Mixed-order example
= Table.Sort(#"Changed Type", {
    {"Category", Order.Ascending},
    {"Sales",    Order.Descending}
  })
As a result, the table arrives at the model already sorted A–Z on Category, with the highest-selling product appearing first inside each category group. Furthermore, this is the foundation for any “ranked list per category” pattern in Power BI — including the matrix-with-Top-N requirement that comes up in nearly every executive dashboard.
Method 4: Custom sort order (customized sorting) with a priority list
Alphabetical order is rarely what the business actually wants. For example, regions usually sort in a strategic order (HQ first, then by revenue), and weekdays should run Mon → Sun rather than Fri → Wed. Specifically, this kind of customized sorting is built by adding a helper column whose values come from List.PositionOf, then sorting on that helper.
Custom sort using List.PositionOf
let
    PriorityOrder = {"DACH", "EMEA", "APAC", "Americas"},

    Source = SalesByRegion,

    #"Added Sort Index" = Table.AddColumn(
        Source,
        "RegionSort",
        each List.PositionOf(PriorityOrder, [Region])
    ),

    #"Sorted Rows" = Table.Sort(#"Added Sort Index", {
        {"RegionSort", Order.Ascending},
        {"Sales",      Order.Descending}
    }),

    #"Removed Helper" = Table.RemoveColumns(#"Sorted Rows", {"RegionSort"})
in
    #"Removed Helper"
Moreover, the same pattern is what powers a robust dynamic date table sort — building a numeric helper column is the universal way to enforce non-alphabetical order in Power BI. Indeed, it works equally well for status workflows (“New → In Progress → Done”), product tiers, and any business hierarchy.
Method 5: Sort within a Group By (latest record per key)
Sorting power query data inside a Group By is how you implement “give me the latest order per customer” or “show me the top-3 products per category”. Specifically, you group on the key column with an “All Rows” aggregation, then sort the nested table inside the group, then keep the first N rows.
Latest record per key — full M code
let
    Source = Orders,

    #"Grouped By Customer" = Table.Group(
        Source,
        {"CustomerID"},
        {{"AllRows", each _, type table}}
    ),

    #"Latest Per Customer" = Table.AddColumn(
        #"Grouped By Customer",
        "LatestOrder",
        each Table.First(
            Table.Sort([AllRows], {{"OrderDate", Order.Descending}})
        )
    ),

    #"Expanded" = Table.ExpandRecordColumn(
        #"Latest Per Customer",
        "LatestOrder",
        {"OrderID", "OrderDate", "Total"}
    )
in
    Table.RemoveColumns(#"Expanded", {"AllRows"})
Consequently, you get one row per customer — their most recent order — without ever leaving Power Query. Furthermore, this pattern is far more efficient than doing the same thing with DAX RANKX over a fact table, especially for imported semantic models where the work should happen upstream.
Method 6: Sort multiple columns and put nulls last
Nulls in Power Query sort to the top by default — which is rarely what you want. However, you can reverse this with a custom comparer that promotes non-null values above nulls before applying the regular sort.
Nulls-last with a custom comparer
= Table.Sort(
    Source,
    (a, b) =>
        if a[OrderDate] = null and b[OrderDate] = null then 0
        else if a[OrderDate] = null then 1
        else if b[OrderDate] = null then -1
        else Value.Compare(a[OrderDate], b[OrderDate])
  )
Specifically, the lambda receives two row records and returns -1, 0, or 1. Moreover, you can chain additional Value.Compare calls on secondary columns inside the same comparer to keep multi-column sort behaviour. As a result, your data lands clean — non-null rows ordered correctly, nulls quarantined at the bottom.
Power BI table visual: sorting by multiple columns
Sorting Power Query data and sorting the Power BI table visual are two different operations — and confusing them is the #1 reason “my sort isn’t working”. Specifically, the Power BI table or matrix visual only honours one click-sorted column at a time in the canvas. However, you can hold Shift and click a second column header to apply a secondary sort.
Two ways to sort a Power BI table by multiple columns
- Shift-click multi-sort. Click the first column header, then hold Shift and click the second. Furthermore, repeat for additional columns. The arrows in each header indicate sort priority.
- Sort By Column (model-level). Specifically, in Model view, select the display column, choose Sort by column, then point it at a numeric helper column. As a result, that column will always sort in the chosen order across every visual — no Shift-click needed.
Moreover, “Sort by column” is the only way to enforce a consistent multi-column order at the model level — for example, weekdays in Mon → Sun order, or month names in calendar order. Indeed, combining a Power Query Table.Sort step with a model-level Sort By Column is the cleanest defence against users accidentally re-sorting reports by clicking visuals.
Editor vs M code — which method to use
Below is the practitioner’s view, after building production models for clients across DACH and the US. Specifically, the right answer is almost always M code for any model you intend to refresh more than once.
Editor vs M code comparison
| Criterion | Editor (UI) | M code (Table.Sort) |
|---|---|---|
| Speed to first sort | Fastest. However, only one column at a time. | Slightly slower. Specifically, all columns in one step. |
| Multi-column in one step | No | Yes |
| Mixed asc / desc | Possible but messy | Native |
| Custom priority lists | Not supported | Yes (List.PositionOf) |
| Sort within Group By | Not supported | Yes (nested sort) |
| Nulls-last behaviour | Not supported | Yes (custom comparer) |
| Maintainability over time | Poor — many tiny steps | Strong — one self-documenting step |
| Recommended for production | No | Yes |
Best practices for Power Query sort multiple columns workflows
Below are the practical rules I apply on every Power BI consulting engagement. Specifically, these rules emerged from real refresh-time issues on multi-million-row fact tables — not from theory.
Five rules for production-grade sorts
- Sort as late as possible. Specifically, place
Table.Sortafter filters and removed columns. As a result, you sort fewer rows and narrower data, which is materially faster. - One sort step per query. Furthermore, multiple sort steps make the M file harder to read and risk being undone by a downstream
Table.Groupor merge. - Avoid sorting fact tables you import. However, do sort dimension tables — calendar, products, regions — where order matters for slicers and matrix visuals.
- Pair Power Query sort with model “Sort By Column”. Specifically, the Power Query sort handles physical row order; the model setting handles visual presentation. Both belong together.
- Test refresh time before and after. Indeed, on tables above five million rows, a multi-column sort can add measurable seconds to refresh — measure, do not assume.
“On large fact tables, a sort step is rarely worth the refresh cost — push the sort to the dimension tables instead, and rely on the model relationships to deliver ordered results in visuals.”
Power BI Background Designer — Figma plugin
Specifically, while you are tidying up your Power Query sort logic, your dashboards deserve a clean canvas to land on. Furthermore, the Power BI Background Designer is a Figma plugin that generates pixel-perfect 16:9 backgrounds with KPI grids, sidebars, and IBCS-friendly layouts — built for Power BI Desktop directly.
DataCamp’s Power BI track covers Power Query M, DAX, and modelling end-to-end. Specifically, the “Data Transformation in Power BI” course walks through Table.Sort, Group By, and merge logic with hands-on exercises. Furthermore, I have reviewed the platform in detail — see my DataCamp Power BI review and overall DataCamp review.
Affiliate disclaimer: This page contains affiliate links to DataCamp. As a result, if you purchase through one of these links, I may earn a small commission at no extra cost to you. Specifically, I only recommend platforms I have personally used and would recommend to clients.
FAQs: sorting multiple columns in Power Query
Common questions about Power Query sort multiple columns syntax
How do I sort by multiple columns in Power Query using M code?
Specifically, use Table.Sort with a list of {column, order} pairs — for example = Table.Sort(Source, {{"Category", Order.Ascending}, {"Sales", Order.Descending}}). Furthermore, this is the same syntax in Power BI Desktop, Excel Power Query, and Microsoft Fabric.
Can I sort one column ascending and another descending?
Yes. However, the trick is that each column inside the comparisonCriteria list carries its own direction. For example, {{"Category", Order.Ascending}, {"Sales", Order.Descending}} sorts Category A–Z and Sales high to low within each category.
How do I sort a Power BI table visual by two columns (PowerBI sort by 2 columns)?
In the report canvas, click the first column header. Then hold Shift and click the second. As a result, both sort indicators appear in the headers. Moreover, for a permanent multi-column order, configure Sort by column on a numeric helper column at the model level. Furthermore, this same DAX-driven Sort by Column setting is what powers most “sort multiple columns in DAX PowerBI” patterns you will see in tutorials.
Advanced FAQs: custom sorts, groups, and performance
How do I apply a custom sort order — for example, weekdays in Mon → Sun order?
Specifically, add a numeric helper column with List.PositionOf({"Mon","Tue","Wed","Thu","Fri","Sat","Sun"}, [Day]), then sort on the helper. Furthermore, this is also how you implement region priority lists, status workflows, and product tiers.
How do I sort within a group — for example, the latest order per customer?
As a result of nesting, you group by the key column with an “All Rows” aggregation, then add a column that calls Table.Sort on the nested table and picks the first row. Specifically, this returns one row per group sorted by your chosen criterion — see Method 5 above for the full M code.
Why does my Power Query sort sometimes “disappear” downstream?
However, Table.Group, Table.Buffer, and merge operations can break row order. Specifically, the safe pattern is to sort right before the operation that needs the order — or to wrap the sorted table in Table.Buffer to materialise the order in memory.
Does sorting in Power Query slow down refresh?
For large fact tables, yes — sorting tens of millions of rows is not free. Specifically, on dimension tables (calendar, products, regions) the cost is negligible, and the benefit is real. Furthermore, my rule is: sort dimensions, leave fact tables alone unless an indexing or top-N pattern explicitly requires order.
Conclusion
Power Query sort by multiple columns is one of the highest-leverage skills in Power BI development — specifically because it removes ambiguity from every downstream step. Furthermore, mastering the six Power Query sort multiple columns methods above means you handle 95% of real-world scenarios from a single Advanced Editor pane: simple multi-column sorts, mixed orders, custom priority lists, sort-within-group, and nulls-last patterns. Indeed, the M code is portable across Power BI Desktop, Excel, Power BI Dataflows, and Microsoft Fabric.
Moreover, if this guide saved you time, you may also enjoy my deep-dive on 8 tips to create an interactive Power BI dashboard, my breakdown of handling multiple data types in one column, and the new Power BI Background Designer Figma plugin. Happy sorting.