
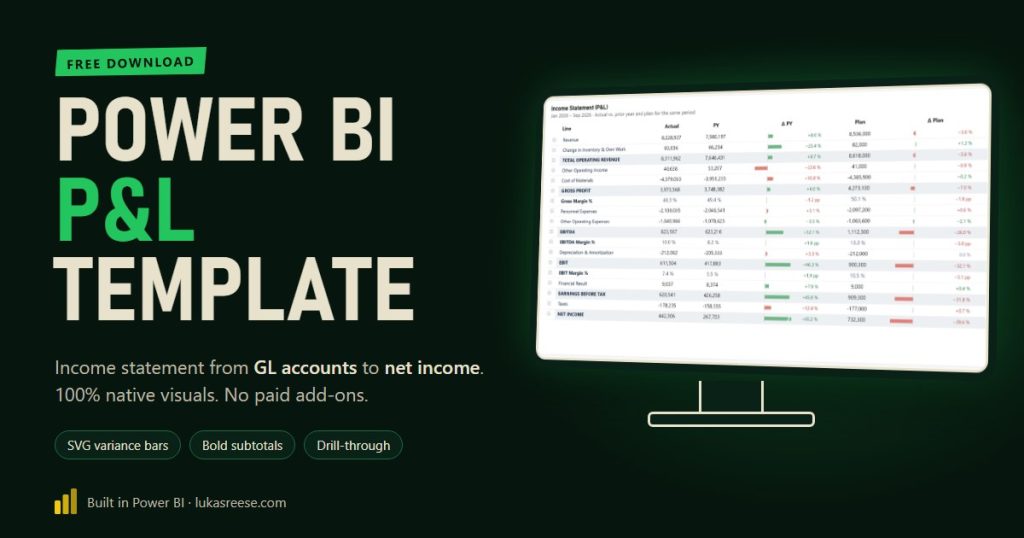
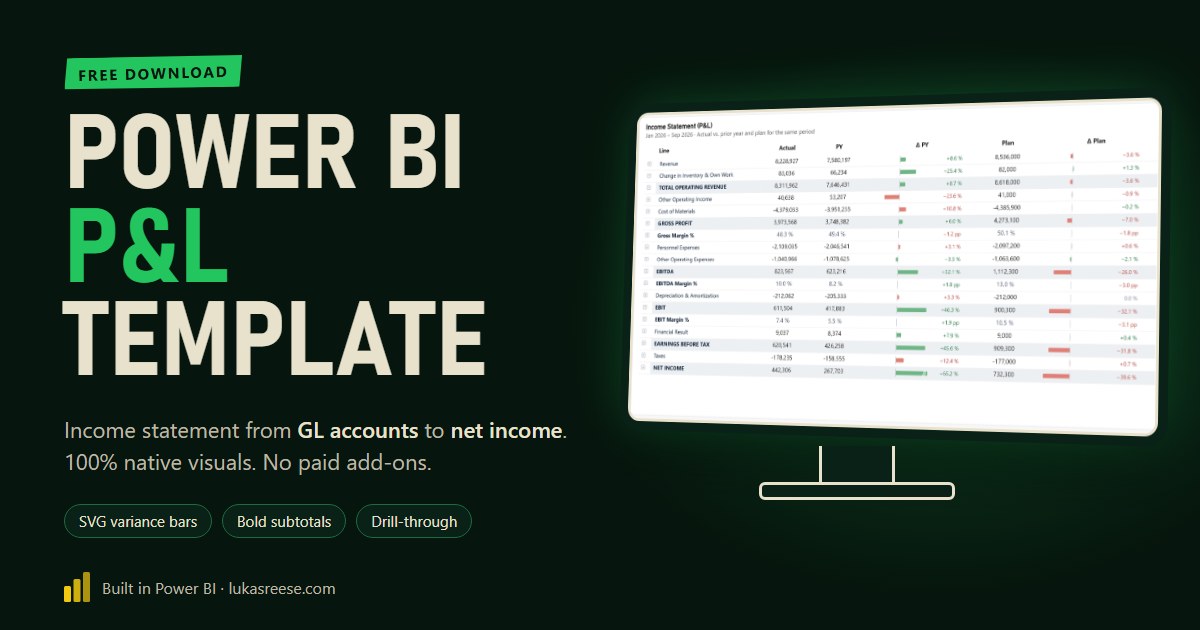
This Power BI P&L template turns raw general-ledger postings into a complete income statement, from revenue down to net income, with prior-year and plan comparisons. It uses only native Power BI visuals, no paid custom visuals, and you can download the full PBIX together with the three CSV files it runs on.
I built it for a client who had a long list of GL accounts but no P&L structure on top of them. The result is a Power BI income statement template that controllers can maintain in a spreadsheet, with bold subtotals, variance bars and a drill-through down to the single posting. Below I walk through how it is built, step by step, so you can map your own chart of accounts.
Get the free Power BI P&L template
PBIX file plus the three CSV files it runs on: postings, GL accounts and the P&L structure. 100% native visuals.
What you get:
- The Power BI file (PBIX) with 3 pages: P&L with SVG, P&L native, drill-through to postings
- 45 documented measures, including bold SVG row labels and variance bars
- 3 CSV files and a README to map your own GL accounts
Important: confirm your email
- After you sign up, you get a confirmation email. Click the button in it, then the download link is on its way.
- Three tables are enough for a Power BI income statement: postings, GL accounts and a P&L structure table.
- You map each GL account to one account type, not to one measure per P&L line.
- Subtotals such as gross profit, EBITDA and EBIT are a running sum over a sort order.
- The native matrix cannot make single rows bold; an SVG measure for the row label can.
- Everything is native Power BI: no custom-visual licence, free PBIX and CSV download.
What’s inside the Power BI P&L template
The template contains one semantic model and three report pages. The model reads three CSV files, so you can replace the dummy data with an export from your ERP system. In addition, every measure carries a description, so the logic stays readable in the field list.
| Page | What it shows | Why it is there |
|---|---|---|
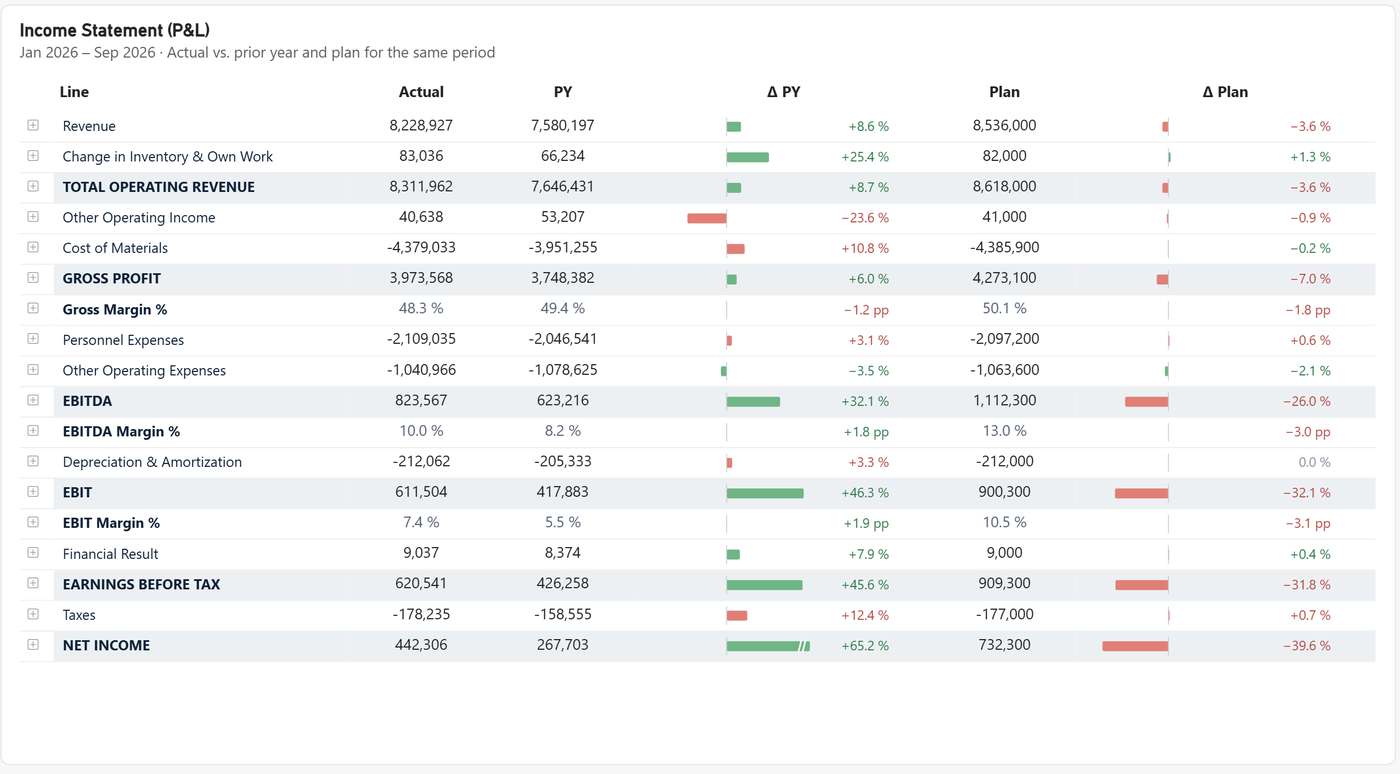
| P&L SVG | Income statement with bold subtotals, grey subtotal bands and variance bars vs. prior year and plan | The finished, presentation-ready version |
| P&L native | The same matrix with standard row headers and arrows ▲▼ | Shows what the native matrix can and cannot do |
| Postings | KPI card, month chart, accounts and single postings for the clicked line | Drill-through target, cross-filtering instead of highlighting |
The data model: three tables from GL account to income statement
A Power BI income statement needs exactly three business tables plus a calendar. The postings table holds the amounts, the GL account table knows the account type of every account, and the P&L structure table decides on which line each account type lands and in which order.
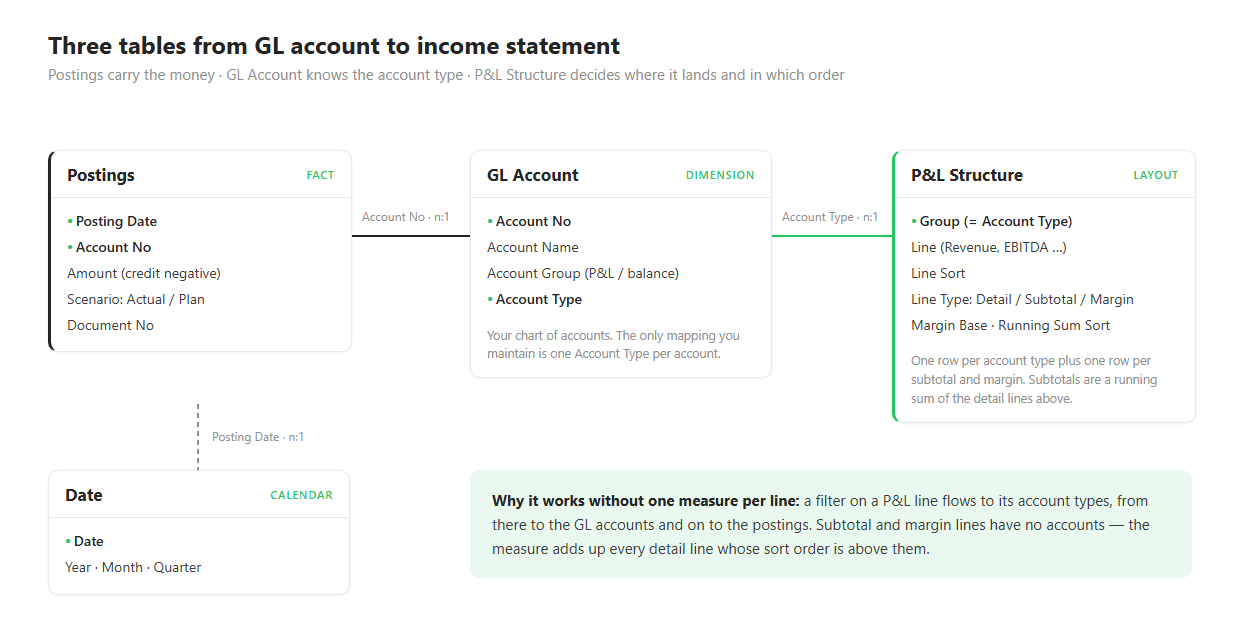
The important design choice is where the mapping lives. In my client’s case, every GL account already had an account type such as “Material Costs” or “Personnel Expenses”, but those types did not match any P&L line. Therefore the template maps account types to P&L lines, not single accounts. As a result, a new GL account only needs its account type, and it appears in the right line automatically.
Map account types to P&L lines, not GL accounts to measures. That keeps a large ledger maintainable in a table of about 30 rows.
The P&L structure table: sort order, line type, running sum
The P&L structure table is the layout of the income statement. Each row is either a Detail line with accounts, a Subtotal or a Margin. A sort order puts the lines in sequence, and that sequence is what makes the subtotals work.
| Line sort | Line | Line type | Calculated as |
|---|---|---|---|
| 10 | Revenue | Detail | Sum of its accounts |
| 30 | TOTAL OPERATING REVENUE | Subtotal | All detail lines above |
| 60 | GROSS PROFIT | Subtotal | All detail lines above |
| 61 | Gross Margin % | Margin | Gross profit ÷ revenue |
| 90 | EBITDA | Subtotal | All detail lines above |
| 110 | EBIT | Subtotal | All detail lines above |
| 150 | NET INCOME | Subtotal | All detail lines above |
A running-sum subtotal is a P&L line without accounts whose value is the sum of every detail line with a lower sort order. Consequently, gross profit, EBITDA and EBIT need no hand-written formula each; one measure covers all of them.
The running-sum sort for lines that count later
Real charts of accounts are messy. For example, my client grouped depreciation under operating costs, which sit above EBITDA. A pure running sum would then make EBITDA equal to EBIT. The extra column Running Sum Sort solves this: depreciation stays in its block for display, but counts into the subtotals only from EBIT onwards.
Why a native Power BI income statement looks plain
The native matrix visual cannot format individual row headers. Microsoft’s documentation states that conditional formatting is not supported for row or column header text, so there is no way to make only “Gross profit” or “EBITDA” bold. Moreover, subtotal rows in a P&L are not real matrix subtotals, so the built-in subtotal styling does not reach them either.
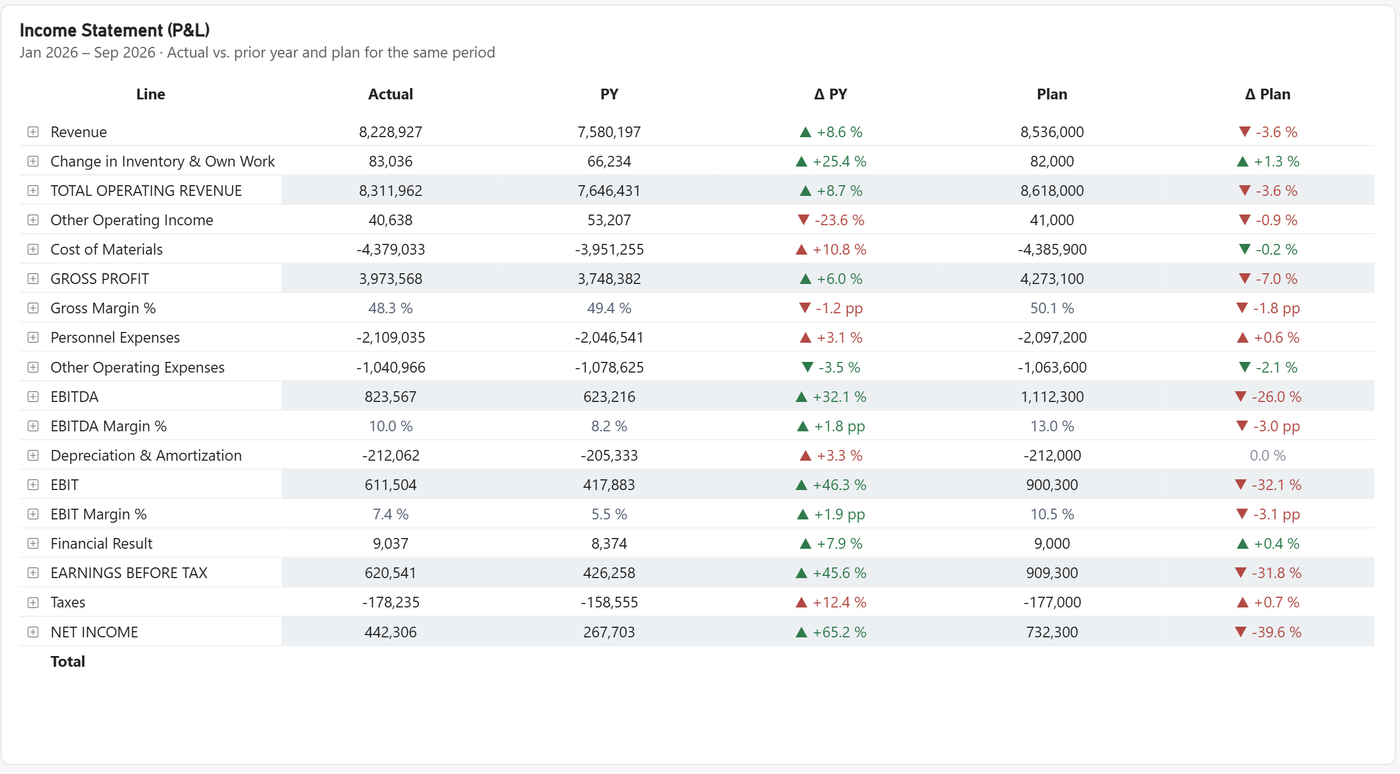
This is the main reason many teams buy a custom visual for financial statements. In my experience, the numbers are rarely the problem; the readability is.
The fix: row labels as SVG measures
The trick is to move the row label out of the row header and into a value column. A DAX measure builds a small SVG image per row that contains the label text, and because it is a measure, it can decide per row whether the text is bold, which colour it has and how far it is indented.
Row headers cannot be formatted per row. Value columns can. So the label becomes a value: an SVG image drawn by a measure.
An SVG measure is a DAX measure that returns an image as text, starting with data:image/svg+xml;utf8,. With the data category set to Image URL, the matrix renders that text as a picture inside the cell.
The settings in Power BI Desktop
| Where | Setting |
|---|---|
| Measure tools → Data category | Image URL for the SVG Label measure |
| Build visual → Values | SVG Label as the first value column, renamed to “Line” |
| Build visual → Rows | Line, Group and GL Account stay in place for drill-down and the +/− icons |
| Format → Row headers → Text → Text color | White, which hides the native label text |
| Format → Grid → Images | Height 22, width 260 (applies to every image in the matrix) |
| Format → Cell elements → Background color → fx | Field value Color Row Band on every value column, so the grey band also runs behind the label |
As a side effect, the empty “Total” row disappears, because its native label is now white as well. Furthermore, every calculated line becomes bold through the line type in the structure table, so a new subtotal in the CSV is bold without touching DAX.
Variance bars with custom colour logic
The variance columns are SVG measures too. Each bar shows the percentage change on a shared scale for prior year and plan, so a +65 % next to a −40 % is visibly longer. In addition, the colour follows the effect on profit, not the sign of the number.
| Line | Change | Bar direction | Colour |
|---|---|---|---|
| Revenue up | +8.6 % | right | green |
| Cost of materials up | +10.8 % | right | red |
| Other operating expenses down | −3.5 % | left | green |
One outlier, for instance +1,000 %, would shrink every other bar to nothing. Hence the scale has a cap: anything above it gets a full bar with a small break mark, while the label still shows the exact value. The cap is a single measure you can change.
Drill-through to single postings
Right-click any line and choose Drill through → Postings to see the KPIs, the monthly trend, the accounts and every single posting behind that line. For subtotals such as EBITDA, the page expands to all detail lines above, using the same running-sum rule as the income statement.
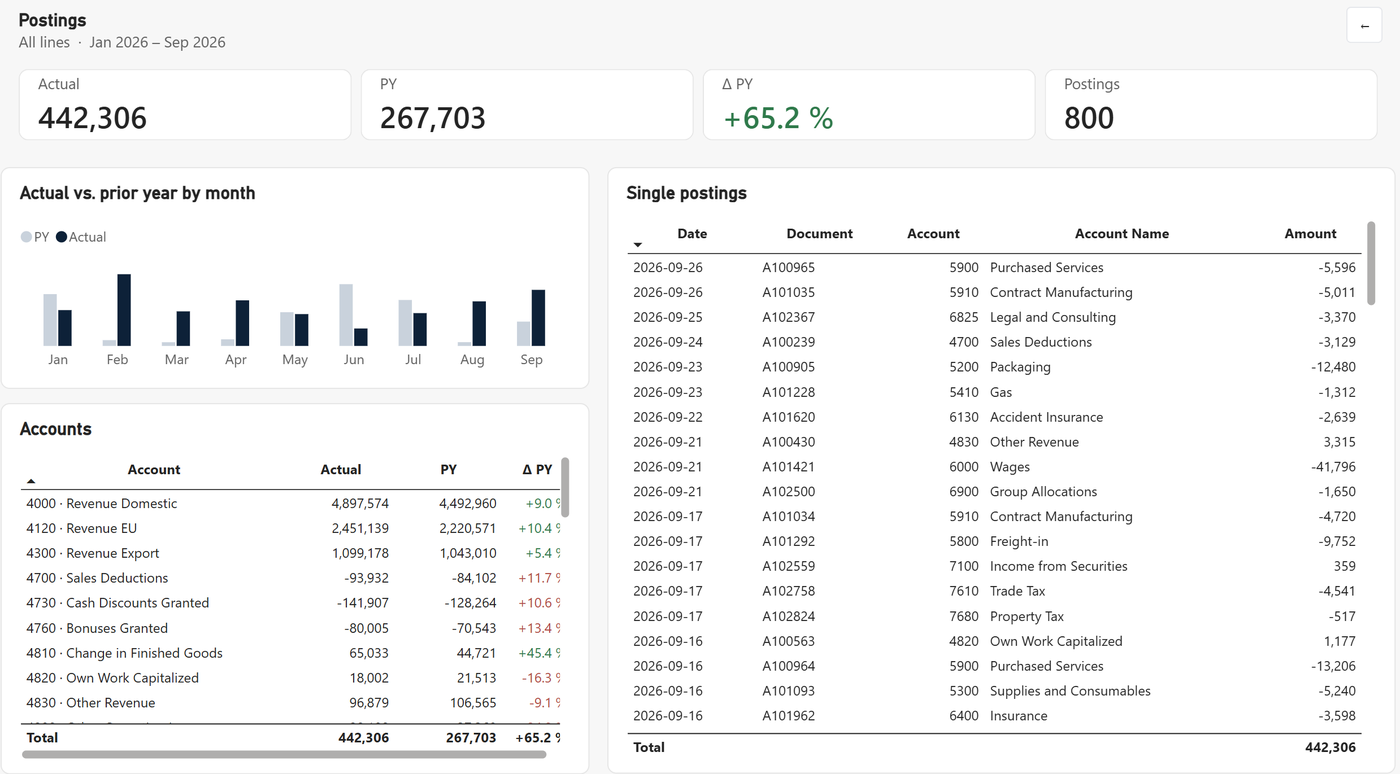
All visuals on this page cross-filter each other rather than highlight. That is deliberate: in a drill-through, a highlighted month next to an unfiltered posting list causes more questions than it answers.
Native visuals vs. paid custom visuals
Paid financial-reporting visuals solve formatting out of the box, and for some teams they are the right choice. However, they come with licence costs per user and an extra approval step in many IT departments. This template shows how far you get with native visuals only.
| Native (this template) | Paid custom visual | |
|---|---|---|
| Licence cost | None | Usually per user or per tenant |
| IT approval | Not needed | Often required for custom visuals |
| Bold subtotals, bands | Yes, via SVG measures | Yes, built in |
| Variance bars | Yes, via SVG measures | Yes, built in |
| Effort to change | Edit a CSV or a measure | Visual settings |
| Excel export | Numbers export cleanly; SVG columns export as text | Depends on the vendor |
How to use the Power BI P&L template with your own data
- Export your postings with date, account number, amount (credit negative) and scenario Actual or Plan into
postings.csv. - Export your chart of accounts into
gl_accounts.csvand give every income-statement account an account type. - Adjust
pl_structure.csv: one row per account type plus your subtotals and margins, in the order you want. - Open the PBIX, set the
DataFolderparameter to the folder with your CSV files and refresh. - Check the quality measures:
QC Differencemust be 0, otherwise an account type is missing in the structure.
FAQ
Is the Power BI P&L template really free?
Yes. You get the PBIX file and the three CSV files for free after entering your email. In particular, there is no custom visual inside, so nothing needs a licence.
Can I make specific rows bold in a Power BI matrix?
Not with the native row headers, because they do not support conditional formatting. Instead, the template draws the row label with an SVG measure, which can be bold for subtotals and regular for detail lines.
How do subtotals like gross profit and EBITDA work without extra measures?
Each subtotal is a running sum of all detail lines with a lower sort order in the P&L structure table. As a result, one measure covers every subtotal, and a new subtotal is just a new row in the CSV.
Can I use my own chart of accounts?
Yes. Replace the three CSV files and give each income-statement account an account type that exists in the P&L structure table. Afterwards, the QC measures show you any account that does not land in a line.
Does it work with Microsoft Fabric or Direct Lake?
The measures and the report work on any semantic model with the same three tables. However, the template ships as an import model on CSV files; for Direct Lake you would point the tables to your lakehouse instead.
Download the Power BI P&L template
PBIX plus three CSV files, 100 % native visuals.
Get the template →Last updated: October 2026 · Built with Power BI Desktop (PBIP format) · Dummy data, no client data.