
Power BI vs Fabric is the question I hear most from fellow report builders right now. In short, Power BI is Microsoft’s visualization and reporting tool, while Microsoft Fabric is the unified data platform that wraps around Power BI and adds data engineering, warehousing, real-time analytics, and data science. Fabric does not replace Power BI — it extends it.
As someone who has spent years deep in DAX, semantic models, and dashboard design, I have been asking myself the same thing you probably are: do I actually need Fabric? In this guide I will walk through what changes, what stays the same, how much it costs, and — most importantly — whether it makes sense for your situation right now. Additionally, I will share the diagnostic tools that Fabric offers, because they solve a pain point that Power BI alone never fully addressed.
- Microsoft Fabric is a unified SaaS analytics platform that includes Power BI as its visualization layer — it does not replace it.
- For day-to-day report building, surprisingly little changes. Your DAX, semantic models, and Power BI Desktop experience remain the same.
- Fabric adds seven workloads: Data Engineering, Data Factory, Data Warehouse, Data Science, Real-Time Intelligence, Data Activator, and Power BI.
- In terms of licensing, Power BI uses per-user pricing (Pro at $14/user/month), while Fabric uses capacity-based pricing starting at roughly $262/month for an F2 SKU.
- Fabric introduces monitoring and diagnostic tools — such as Monitoring Hub, Capacity Metrics App, and Query Insights — that Power BI alone does not offer.
- Most solo practitioners and small teams do not need Fabric today, but enterprise teams with complex data pipelines will benefit immediately.
What Is Microsoft Fabric, and How Does It Relate to Power BI?
Microsoft Fabric is Microsoft’s unified SaaS analytics platform that brings together data engineering, data warehousing, real-time analytics, data science, and business intelligence into a single environment. Consequently, it is built on top of a shared storage layer called OneLake. In simple terms, if Power BI is the cockpit where you fly the plane, Fabric is the entire airport — runways, fuel systems, air traffic control, and all.
OneLake is Fabric’s centralized data lake, built on open Delta Lake format, that automatically stores all data across every Fabric workload in one place. As a result, there is no need to copy data between services or maintain separate storage silos.
Fabric consists of seven core workloads that share this single storage layer:
- Data Engineering — Apache Spark–based notebooks and lakehouses for large-scale data transformation.
- Data Factory — orchestrates data movement and ETL/ELT pipelines (similar to Azure Data Factory).
- Data Warehouse — enterprise SQL analytics with automatic optimization.
- Data Science — machine learning model development, training, and deployment.
- Real-Time Intelligence — processes streaming data through Event Streams and KQL databases.
- Data Activator — automates responses to data events and triggers alerts based on real-time conditions.
- Power BI — the reporting and visualization layer that connects to all other workloads.
“Power BI is one of seven workloads inside Fabric. It is the part you see as a report consumer — but Fabric handles everything that happens before data reaches your dashboard.”

Power BI vs Fabric — What Actually Changes?
For day-to-day report building, surprisingly little changes when you move from standalone Power BI to Fabric. Your DAX formulas still work. Your semantic models stay the same. Moreover, Power BI Desktop looks and feels identical. However, the infrastructure beneath your reports becomes significantly more capable.
| Dimension | Power BI (Standalone) | Power BI + Fabric |
|---|---|---|
| Data storage | Import mode or DirectQuery | Additionally supports OneLake + Direct Lake mode |
| Data transformation | Power Query only | Furthermore includes Spark notebooks + Data Factory pipelines |
| Report building | Power BI Desktop | Similarly uses Power BI Desktop (identical experience) |
| Semantic models / DAX | Full support | Likewise unchanged and fully supported |
| Deployment | Publish to workspace | In addition supports git integration + deployment pipelines |
| Real-time data | Limited streaming datasets | Real-Time Intelligence with KQL + Event Streams |
| Data science / ML | Not available | Consequently adds Spark notebooks and ML model support |
| Governance | Workspace-level settings | Centralized governance via Microsoft Purview integration |
| Monitoring | Performance Analyzer in Desktop | Additionally includes Monitoring Hub, Capacity Metrics App, and Query Insights |
What Stays the Same — Reassurance for Power BI Users
If you have spent years learning DAX, building semantic models, and designing dashboards, none of that knowledge becomes obsolete. Specifically, Power BI Desktop remains your primary authoring tool. Your existing reports continue to work without modification. In other words, the skills you have built are the foundation Fabric builds on — not something it replaces.
Furthermore, Power Query remains fully supported for data transformation. Your dashboard design best practices carry over directly. Indeed, the report-building experience inside Fabric is the same Power BI you already know.
What Is Genuinely New in Fabric
The most impactful new capability is Direct Lake mode. Rather than choosing between Import (fast but memory-heavy) and DirectQuery (live but slow), Direct Lake reads Parquet files directly from OneLake. As a result, you get Import-like performance without duplicating data into memory. For large datasets, this is a significant advantage.
Additionally, Fabric introduces native git integration and deployment pipelines. Consequently, you can version-control your reports, manage separate development and production environments, and automate deployments — workflows that were cumbersome or impossible with standalone Power BI.
Power BI vs Fabric — Licensing and Cost Compared
Power BI uses per-user pricing, while Fabric uses capacity-based pricing measured in Fabric Capacity Units (CUs). A Fabric Capacity Unit is the compute resource that powers all Fabric workloads — the more CUs your SKU includes, the more concurrent operations it can handle. This difference fundamentally changes how you budget for analytics. Here is how the main tiers compare:
| License Tier | Price | Model | Best For |
|---|---|---|---|
| Power BI Pro | $14/user/month | Per-user | Small teams, basic sharing and collaboration |
| Power BI PPU | $20/user/month | Per-user | Advanced features for individual users |
| Fabric F2 | ~$262/month | Capacity (2 CUs) | Entry-level Fabric, small workloads |
| Fabric F64 | ~$5,000+/month | Capacity (64 CUs) | Enterprise, replaces former P1 Premium |
The Break-Even Math for Power BI vs Fabric
At roughly 350 or more Power BI Pro users, a Fabric F64 capacity becomes more cost-effective than individual per-user licenses. However, for a team of 20 people, Pro licensing at $14 per user totals just $280 per month — comparable to a single F2 SKU that offers far less compute power. As a result, small teams almost always save money by staying with per-user licensing.
For freelancers and small consultancies, Fabric capacity licensing rarely makes financial sense on its own. Nevertheless, if your client’s organization already has Fabric capacity, you benefit from those features without paying for the capacity yourself.
Fabric Diagnostic and Monitoring Tools That Power BI Lacks
One of Fabric’s most underrated advantages is its built-in diagnostic and monitoring toolset. If you have ever struggled to figure out why a Power BI report loads slowly — and been limited to the Performance Analyzer in Desktop — Fabric offers significantly more visibility. Specifically, there are four key monitoring tools worth knowing about.
Monitoring Hub
The Monitoring Hub is a centralized dashboard inside the Fabric portal that shows all active and recent activities in real time. For example, you can track dataset refreshes, Spark job executions, pipeline runs, and dataflow operations from a single location. In contrast, standalone Power BI scatters this information across multiple admin pages. According to Microsoft’s documentation, the Monitoring Hub supports filtering by item type, status, and workspace.
Capacity Metrics App
The Microsoft Fabric Capacity Metrics App is a prebuilt Power BI report — developed by Microsoft — that monitors capacity utilization, throttling events, and system performance over a rolling 14-day window. As a result, administrators can identify which items consume the most Fabric Capacity Units (CUs) and take action before performance degrades. In other words, it turns capacity management from reactive firefighting into proactive governance, as described in the official Capacity Metrics documentation.
Query Insights and Workspace Monitoring
Query Insights stores execution data for completed queries, including CPU time, duration, and data volume scanned. Consequently, when a report runs slowly, you can trace the exact query that caused the delay rather than guessing. Furthermore, Workspace Monitoring lets you access logs and metrics for all Fabric items in a workspace through a queryable database. Together, these tools provide the kind of end-to-end observability that Power BI alone simply does not offer.
Do You Actually Need Fabric? When Companies Should Switch
Most Power BI practitioners do not need Microsoft Fabric today — but that window is narrowing. The right time to adopt depends on your team size, data complexity, and organizational direction. Here is a practical decision framework based on common scenarios.
Stick with Power BI Instead of Fabric If…
- Your team has fewer than 20 Power BI users and per-user licensing is cost-effective.
- Your data is already clean, structured, and lives in a single source like SQL Server or Excel.
- Moreover, you have no data engineering needs beyond what Power Query can handle.
- Your organization has no enterprise mandate to move to Fabric.
Consider Fabric If…
- You pull data from multiple sources and spend significant time on data preparation and pipeline management.
- Your team includes data engineers, data scientists, or SQL analysts alongside BI developers.
- In addition, you need git-based version control and automated deployment pipelines for your Power BI content.
- Real-time analytics — such as streaming IoT data or live event processing — is a business requirement.
- Your organization is moving toward a lakehouse or data mesh architecture.
- Furthermore, you already have Fabric capacity through a Microsoft Enterprise Agreement or existing Premium subscription.
Which Companies Benefit Most from Fabric over Power BI?
In my experience, three types of organizations get the most immediate value from Fabric. First, mid-size to large enterprises (200+ employees) with multiple data teams benefit from the unified governance and shared OneLake storage. Second, organizations currently running Azure Synapse, Azure Data Factory, and Power BI separately can consolidate those tools under one Fabric roof — reducing management overhead. Third, companies with Power BI Premium are essentially on Fabric already, since Microsoft has mapped P SKUs to F SKUs.
On the other hand, solo consultants, freelancers, and small teams under 20 people should generally wait. The learning curve is steep, the capacity pricing does not favor small-scale usage, and most small-team reporting scenarios work perfectly well with Power BI Pro. However, understanding Fabric is still worth your time — because your clients may be adopting it.
“Fabric solves problems that most Power BI users don’t have yet — and that’s perfectly okay. However, learning what it offers now means you’ll be ready when your clients or employer make the switch.”
How Fabric Changes Power BI Development Workflows
This is where Power BI vs Fabric gets real. The biggest practical shift is not a new button or feature — it is a fundamentally different development strategy. In standalone Power BI, you own the entire pipeline: connect to data, transform it in Power Query, build the model, design the report. In Fabric, that pipeline splits across teams and tools. Here is what actually changes.
Direct Lake Mode — What It Gives You and What It Takes Away
Direct Lake mode reads Parquet files directly from OneLake without importing data into memory or sending live queries to the source. In effect, you get near-Import performance with near-DirectQuery freshness. However, it comes with significant trade-offs that every Power BI developer needs to understand.
Specifically, Direct Lake does not support calculated columns, calculated tables, or composite models. If you have been using calculated columns in your semantic model, you must either pre-compute those values in the lakehouse or warehouse, or rewrite them as DAX measures. Furthermore, when Direct Lake cannot handle a query — for example, due to too many Parquet files, memory pressure, or views instead of tables — it silently falls back to DirectQuery mode, which is noticeably slower. You can control this behavior using the DirectLakeBehavior property, as described in the Direct Lake overview on Microsoft Learn.
Additionally, RLS behaves differently depending on where it is defined. Row-level security at the semantic model layer works without fallback. However, RLS or OLS defined at the SQL Analytics Endpoint level triggers a DirectQuery fallback — which can catch you off guard if you are not expecting the performance difference.
Report Editing Moves to the Browser
This is one of the biggest adjustments for Power BI Desktop power users. When working with Direct Lake semantic models, you can live-edit the semantic model from Power BI Desktop — but the report view is removed during live editing. In other words, you can modify measures, relationships, and table properties from Desktop, but you cannot design report pages there. Instead, report editing happens in the Power BI service web editor.
Similarly, the Table View is removed during Desktop live editing (unless your model contains a calculation group or calculated table). Consequently, the familiar “Desktop-first” workflow — where you build everything locally and publish when ready — does not fully apply in Fabric. Moreover, the web editor uses AutoSave, meaning changes are applied immediately with no undo button. Version history exists and creates a snapshot when you start a live editing session, but it is not the same as pressing Ctrl+Z.

For a more complete local editing experience, you can use the PBIP (Power BI Project) format, which downloads the semantic model metadata without the data. However, this requires XMLA endpoints to be enabled (more on that below).
No More Power Query — Your Data Team Owns ETL
In standalone Power BI, you are responsible for the entire data preparation process. You connect to sources in Power Query, write M code to clean and transform data, and then load it into your semantic model. In a Fabric environment with Direct Lake, that entire layer disappears from your workflow. Instead, your data engineering team prepares the data using Spark notebooks or Data Factory pipelines, and you read the finished tables from the lakehouse or data warehouse.
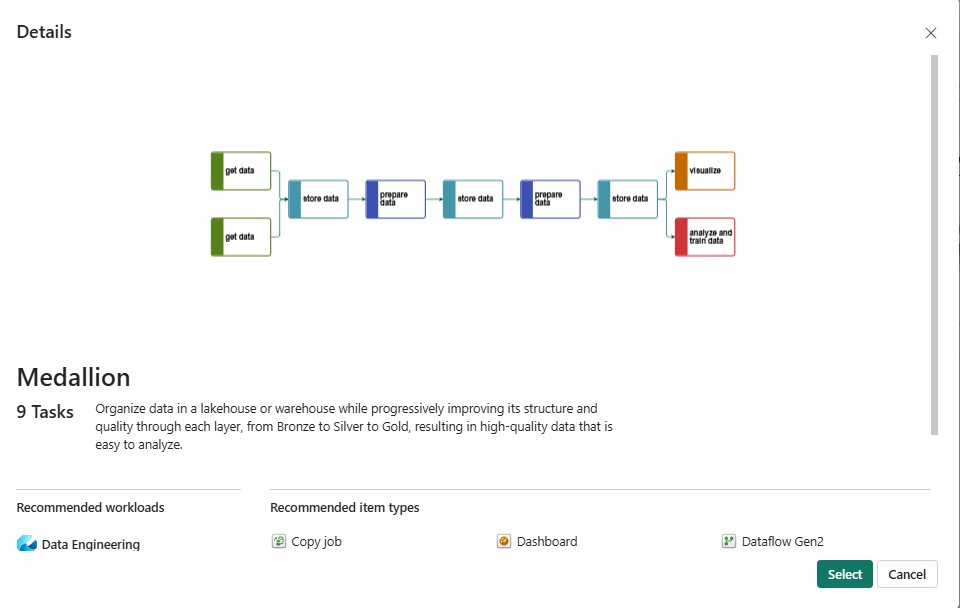
In many Fabric environments, teams follow the Medallion architecture (Bronze → Silver → Gold layers), where raw data is progressively cleaned and enriched before it reaches your semantic model. As a result, the data you build reports on has already been through multiple quality gates — but you are no longer the one running those transformations. This is a fundamental mindset shift: from full-stack BI developer to specialized report builder working with curated data.
For Power BI developers used to owning the entire pipeline, this can feel like losing control. Nevertheless, it also means you spend less time on ETL and more time on what matters most — designing effective visualizations and writing precise DAX. The trade-off is worth understanding before you commit.
XMLA Endpoints — Required for Desktop Development in Fabric
If you want to develop a Direct Lake semantic model from Power BI Desktop rather than the web editor, you need XMLA read/write endpoints enabled on your Fabric capacity. Starting June 2025, Microsoft enabled XMLA read/write by default on all Power BI and Fabric capacity SKUs, as announced in the Fabric blog. Consequently, tools like Tabular Editor, SSMS, and Power BI Desktop can connect to and modify semantic models directly.
This is especially important for enterprise clients who need advanced modeling features — such as calculation groups, metadata translations, and perspectives — that are only available through XMLA-based tools. However, if your capacity admin has not enabled XMLA write, you are limited to the web modeling experience.
Git Integration and Deployment Pipelines
For enterprise teams, git integration is arguably Fabric’s most important feature for Power BI. Fabric workspaces can connect directly to Azure DevOps or GitHub repositories. As a result, every change to a report, semantic model, or pipeline is version-controlled. If you have already explored the PBIR enhanced report format, this is where it truly shines — PBIR files are JSON-based and diff-friendly, making git integration actually useful rather than decorative.
Similarly, deployment pipelines let you promote content from Development to Test to Production workspaces with a few clicks. For teams that have compared PBIX vs PBIR vs PBIP formats, Fabric’s git integration is the reason those new formats exist. Furthermore, if you use TMDL for semantic modeling, Fabric provides the environment where version-controlled models become a natural part of your workflow. This capability does not exist in standalone Power BI Pro or PPU — it requires Fabric capacity.

What Happened to Power BI Premium?
Microsoft retired Power BI Premium per-capacity licenses (P SKUs) and transitioned them to Fabric F SKUs. Specifically, the last day to purchase or renew a P SKU was January 31, 2025. From February 1, 2025 onward, all new purchases and renewals must use Fabric F SKUs. For non-Enterprise Agreement customers, the end-of-life date was January 1, 2026, while Enterprise Agreement customers have until January 1, 2028, according to Microsoft’s official licensing update.
Existing Premium subscriptions have been mapped to equivalent Fabric capacities: P1 maps to F64, P2 to F128, P3 to F256, P4 to F512, and P5 to F1024. Accordingly, if your organization was running Power BI Premium, you are already on Fabric infrastructure — whether you actively use Fabric workloads or not. In other words, there is no “Premium vs. Fabric” choice to make. They have merged, and all Premium features — such as paginated reports, deployment pipelines, and XMLA endpoints — are now available under the Fabric SKUs.
Honest Limitations — Where Fabric Still Falls Short
Fabric is powerful but still maturing. As of April 2026, there are real gaps worth knowing about before you commit. Above all, it is important to go in with realistic expectations.
- Steep learning curve for BI-only teams. If your team only knows Power BI, adopting Spark notebooks, KQL, and Data Factory pipelines requires significant upskilling. Consequently, budget for training time.
- Pricing can be hard to predict. The Capacity Unit (CU) consumption model means costs vary with usage rather than staying fixed. As a result, organizations without clear usage patterns may face surprise bills.
- Some workloads still feel bolted together. While the vision is a unified platform, certain transitions between workloads — for example, moving from a notebook to a Power BI semantic model — are not yet seamless.
- Documentation is improving but inconsistent. In particular, some features have thorough guides while others are documented only in blog posts or community forums.
- Regional feature availability varies. Not all Fabric capabilities are available in every Azure region. Therefore, check the Fabric region availability page before planning your rollout.
“Fabric is not a finished product — it is an actively evolving platform. Accordingly, expect quarterly feature additions and occasional rough edges, especially outside the core Power BI workload.”
Where to Learn Microsoft Fabric
If you decide to explore Fabric, the good news is that structured learning paths already exist. Here are the best options as of 2026, organized by learning style.
Microsoft Learn (Free)
Microsoft’s own Get Started with Microsoft Fabric learning path is free and covers the fundamentals across all seven workloads. Additionally, it is the official preparation material for the DP-600: Fabric Analytics Engineer Associate certification — currently the most recognized Fabric credential in the market.
DataCamp Fabric Courses
For a more hands-on, structured approach, DataCamp’s Introduction to Microsoft Fabric course walks you through the platform in roughly 4 hours with interactive exercises. Furthermore, DataCamp offers additional courses including Transform and Analyze Data with Microsoft Fabric and Data Ingestion and Semantic Models with Microsoft Fabric. These courses were developed in collaboration with Microsoft. In my experience, DataCamp’s interactive format works well for Power BI users who learn by doing rather than watching.
Fabric Community and Blogs
The Microsoft Fabric Community forums are active and helpful for troubleshooting. Similarly, the official Microsoft Fabric Blog announces new features and provides technical deep-dives. For Power BI–specific perspectives on Fabric, practitioners like Guy in a Cube and SQLBI regularly publish content that bridges the gap between BI and the broader Fabric platform.
Frequently Asked Questions
Is Microsoft Fabric replacing Power BI?
No. Fabric does not replace Power BI — rather, it includes Power BI as one of its seven core workloads. Specifically, the report-building and visualization experience remains exactly the same. However, Fabric adds data engineering, warehousing, and science capabilities around it. You can think of Fabric as the platform and Power BI as the front end.
Do I need Fabric if I already have Power BI Pro?
For most small teams, Power BI Pro is sufficient. You only need Fabric when you require capabilities beyond what Pro offers — for example, large-scale data engineering, real-time analytics, or centralized governance across multiple data teams. In other words, if Pro covers your reporting needs and your data is already clean, there is no urgency to switch.
Can I use Power BI without Fabric?
Yes. Power BI continues to operate as a standalone product. Accordingly, you can connect Power BI Desktop to your existing data sources, publish reports to the Power BI service, and share dashboards with Power BI Pro licenses — all without touching Fabric. However, certain newer features like Direct Lake mode and git-based deployment require Fabric capacity.
What is OneLake and why should Power BI users care about it?
OneLake is Fabric’s unified storage layer that holds all data in open Delta Lake format. For Power BI users, it matters because it enables Direct Lake mode — a storage mode that gives you Import-like query performance without copying data into memory. As a result, you avoid the classic Import vs. DirectQuery trade-off and work with fresher data at faster speeds.
How much does Microsoft Fabric cost compared to Power BI Pro?
Power BI Pro costs $14 per user per month, while Fabric capacity starts at approximately $262 per month for an F2 SKU (2 Fabric Capacity Units). The break-even point is roughly 350 users, where an F64 capacity becomes cheaper than individual Pro licenses. For teams under 50 people, per-user Pro licensing is almost always more cost-effective. For current pricing, see the official Fabric pricing page.
Should a freelancer or small consulting team adopt Fabric?
In most cases, not yet. Fabric’s capacity-based licensing does not favor small-scale usage, and the learning curve is steep. Nevertheless, understanding Fabric is still valuable because your clients may be adopting it. Consequently, learning the fundamentals — especially Direct Lake, OneLake, and deployment pipelines — positions you to deliver more value when enterprise clients ask for Fabric expertise.
🎓 Level Up Your Career with Power BI & DataCamp!
Learn Power BI, SQL & Data Skills Trusted by Top Companies. What are you waiting for?
Continue exploring Power BI guides
If you found this comparison helpful, explore these related guides for Power BI practitioners:
Last updated: April 17, 2026. Pricing and feature availability may change — always verify against Microsoft’s official documentation.