22/10/2025
Is OpenAI Atlas Browser the Future of Data Analytics? Impact Analysis and Real-World Applications Table of Contents What Is OpenAI Atlas Browser and Why Does It […]
17/10/2025
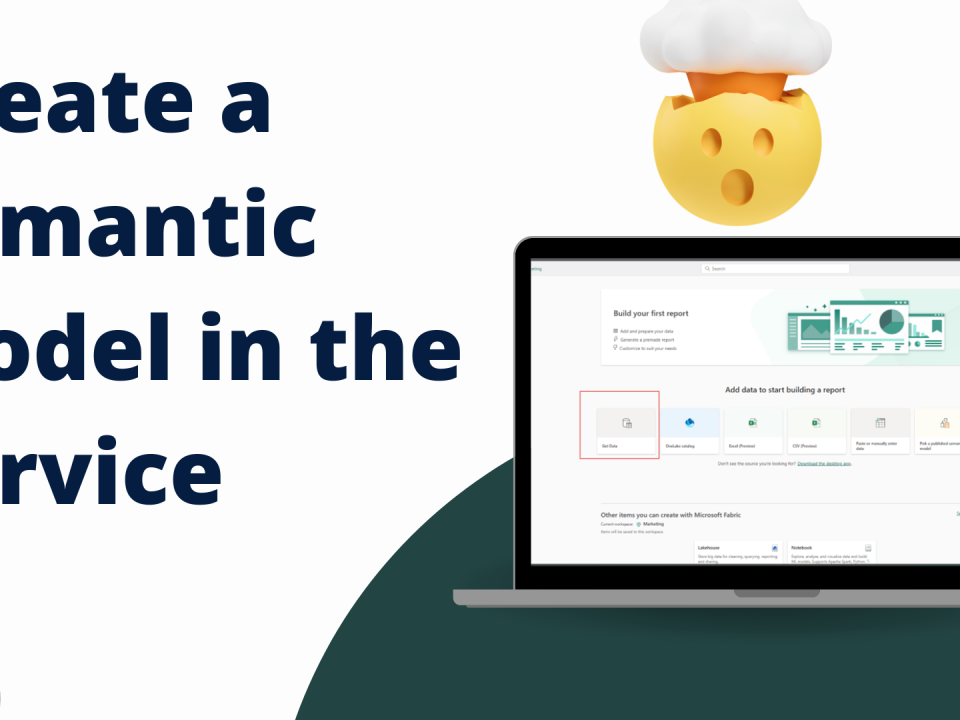
How to Create Power BI Semantic Models in the Service Complete guide to browser-based data modeling without Power BI Desktop 📊 Semantic Modeling 🌐 Browser-Based 🍎 […]
26/08/2025
Expert DataCamp Power BI Review 2025: Complete analysis of all learning tracks, individual courses, and professional certification preparation. Source: Professional Analysis Understanding whether datacamp power bi […]
24/08/2025
📋 Table of Contents What is the COPILOT Function in Excel? Licensing Requirements & Access Getting Started: Setup & Basic Usage Function Syntax & Parameters Practical […]
23/08/2025
📋 Table of Contents Sales Data Crisis & Manual Process Costs Business Intelligence Sales Solutions Overview Power BI Sales Dashboards for Performance Tracking Windsor.ai: Sales Data […]
23/08/2025
📋 Table of Contents What is Business Intelligence Consulting? Why Your Business Needs a BI Consultant My Proven BI Consulting Roadmap Power BI Consulting Services From […]
22/08/2025
Table of Contents DataCamp SQL Complete Overview: What You Need to Know DataCamp SQL Tracks: Complete Course Breakdown Real User Reviews: What People Actually Say About […]
22/08/2025
📋 Table of Contents Understanding Power BI Canvas Size Default Canvas Dimensions Analysis Expert Canvas Size Recommendations Step-by-Step: How to Change Canvas Size Page View Settings […]
20/08/2025
📋 Table of Contents Why Power BI Dashboard Design Best Practices Matter Essential Power BI Design Tips for Professional Dashboards Advanced Dashboard Design Principles for Power […]
19/08/2025
📋 Table of Contents Why Dashboard Design Is Harder Than It Looks The Fundamental Pain Points in Dashboard Design How I Solved These Dashboard Design Challenges […]
19/08/2025
📋 Table of Contents Understanding Dashboard UI Design Inspiration Essential Dashboard Building Blocks Modern Dashboard UI Design Examples Analysis F-Pattern vs Z-Pattern Layout Psychology Dashboard Background […]
19/08/2025
Table of Contents What Are Dashboard Wireframe Examples? 71 Power BI Dashboard Design Categories Power BI Background Designer Tool How Dashboard Wireframe Examples Save Time Dashboard […]
19/08/2025
📋 Table of Contents What is a Power BI Background Image and Why It Matters Power BI Canvas Size and Dimensions: Technical Foundation Professional Dashboard Background […]
22/03/2025
Power BI continues to evolve with new features that empower data professionals to work faster, smarter, and more collaboratively. One of the most exciting additions is […]
18/03/2025
The Power BI Update 2025 February introduces a suite of enhancements designed to elevate your data analysis and visualization experience. Here’s a comprehensive overview of the […]
18/03/2025
Disclosure: Some of the links in this post are affiliate links. This means that if you click on the link and purchase the item, I may […]
15/03/2025
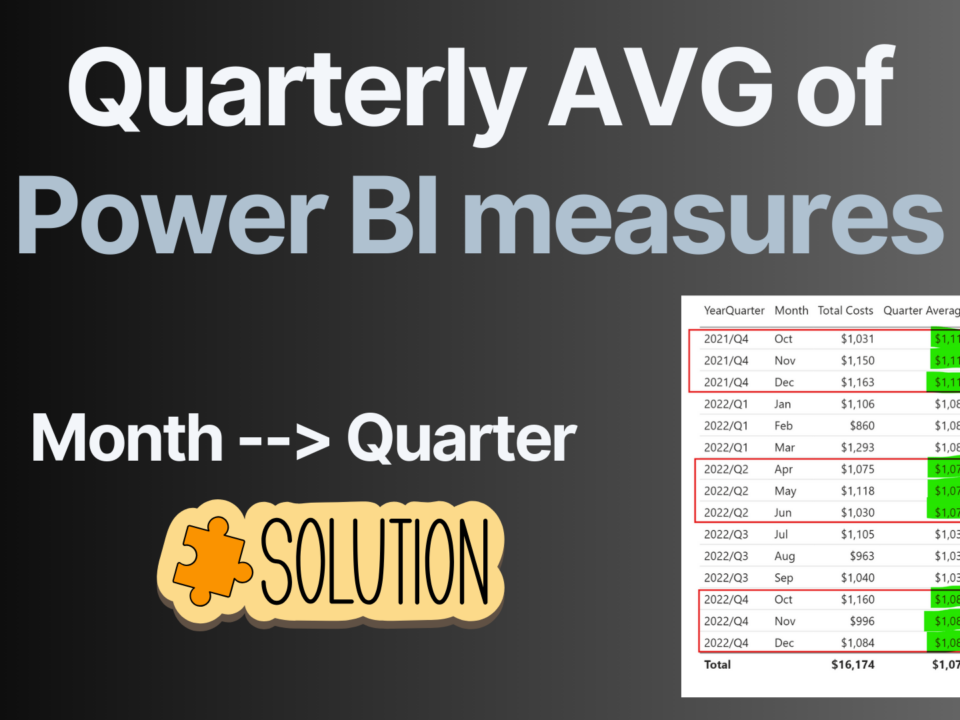
Introduction Sometimes, it makes sense to calculate quarterly average of measure in Power BI instead of looking at raw monthly data. Whether you’re analyzing sales numbers, […]
14/03/2025
Introduction If you’ve ever encountered the error message “Expression.Error: We cannot apply field access to the type Text” when refreshing a Power BI dataflow, you’re not […]
01/01/2025
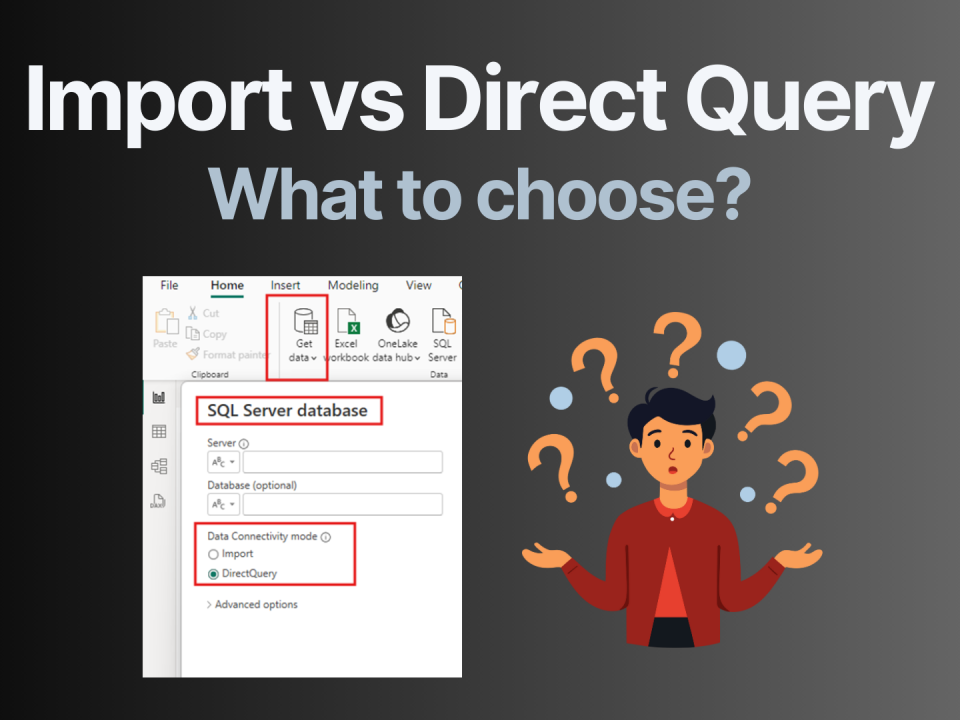
Introduction Power BI offers flexible options for connecting to data, including Direct Query, Import Mode, and Composite Models. Choosing the right mode is important to ensure […]
27/12/2024
Einleitung Power BI bietet flexible Lizenzmodelle für Unternehmen jeder Größe, von der kostenlosen Nutzung mit Power BI Desktop bis hin zu fortgeschrittenen Funktionen mit Microsoft Power […]
26/12/2024
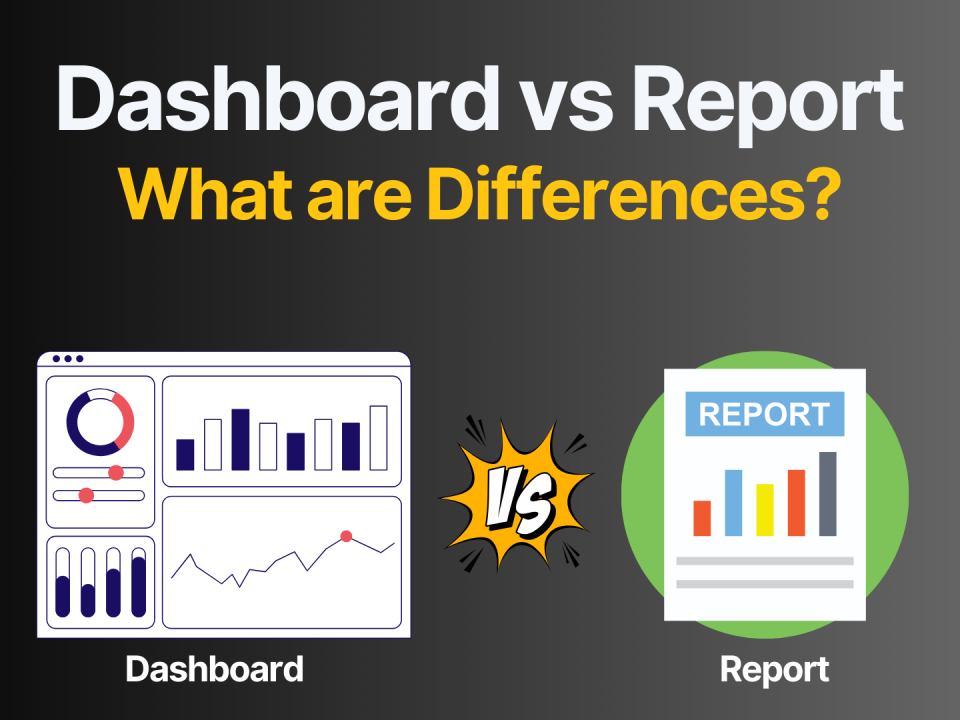
Introduction For new Power BI users, the terms “dashboard” vs “report” are often used interchangeably, leading to confusion about their true purposes. While both dashboards and […]
26/12/2024
Introduction: Power BI Alerts As a Power BI developer, I often get requests from clients who want custom notifications or alerts in Power BI. They don’t […]
22/12/2024
Disclosure: Some of the links in this post are affiliate links. This means that if you click on the link and purchase the item, I may […]
21/12/2024
Power BI scheduled refresh ensures your reports and dashboards display the most current data without manual intervention. By automating data updates, you can maintain data accuracy, […]
21/12/2024
Power BI is Microsoft’s powerful business analytics tool that enables users to visualize and share insights from their data. However, Microsoft has not developed a native […]
21/12/2024
Power Query sort by multiple columns is one of the most fundamental tasks for organizing and analyzing data efficiently. Moreover, when working with large datasets, sorting […]
11/12/2024
If you’re preparing for a Power BI interview, this guide is for you. Power BI interview questions can range from basic concepts to advanced data modeling […]
08/12/2024
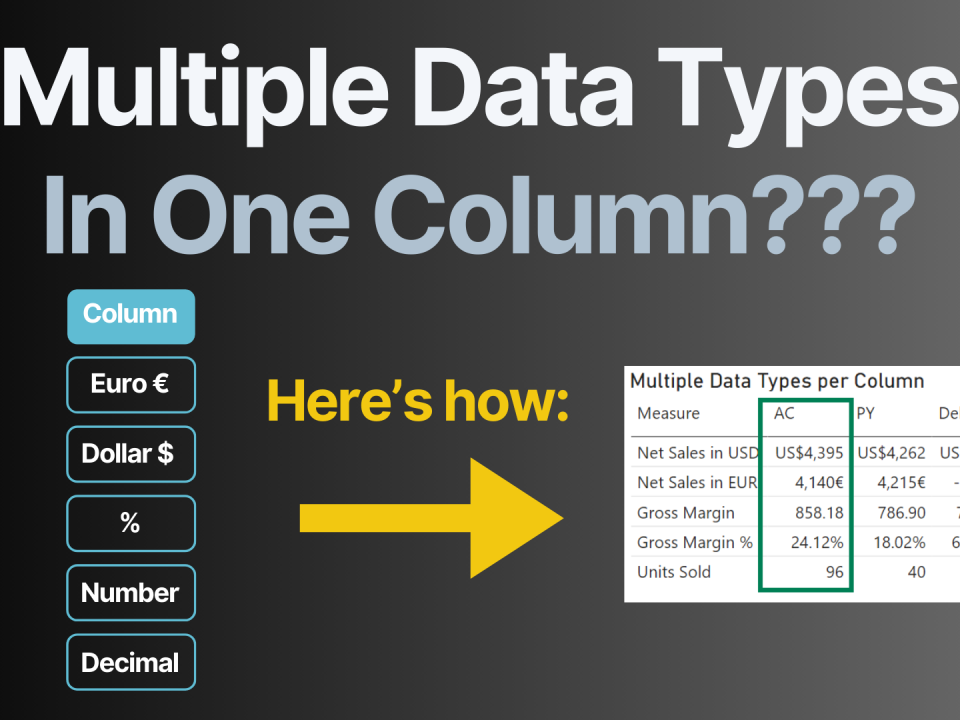
Displaying multiple data types in a single column within Power BI isn’t supported natively, but with some creative workarounds, you can achieve dynamic visuals that accommodate […]
10/11/2024
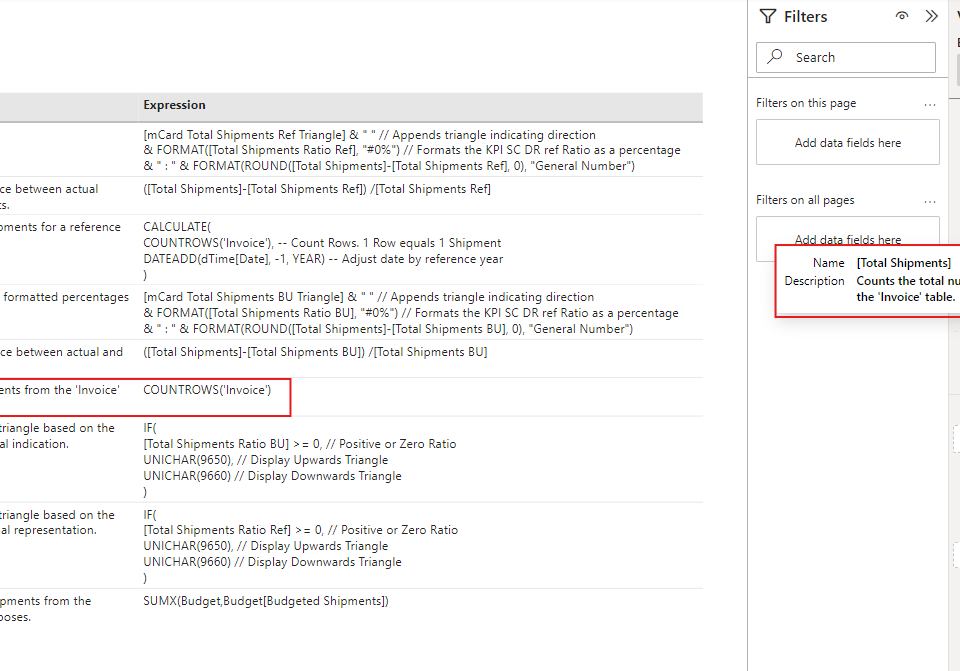
Quick Summary: Learn how to automate updating measure descriptions in Power BI. Connect and edit your data model using Tabular Editor 2. Utilize C# scripts generated […]
26/09/2024
Introduction When I first posted on LinkedIn about Power BI best practices, I never expected such amazing feedback and shared experiences from the community. It became […]
24/09/2024
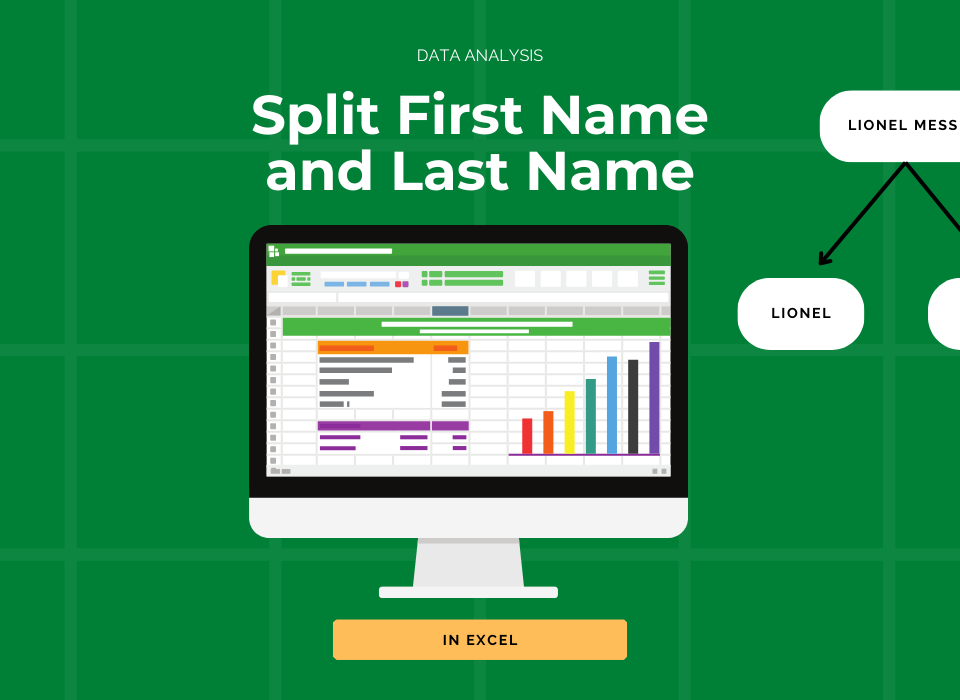
Managing data effectively in Excel often involves transforming full names into separate first and last names. Whether you’re working with a simple list of names or […]
21/09/2024
Managing a Power BI data model can get overwhelming when old or unused measures start to pile up. Deleting them one by one can be time-consuming, […]
18/09/2024
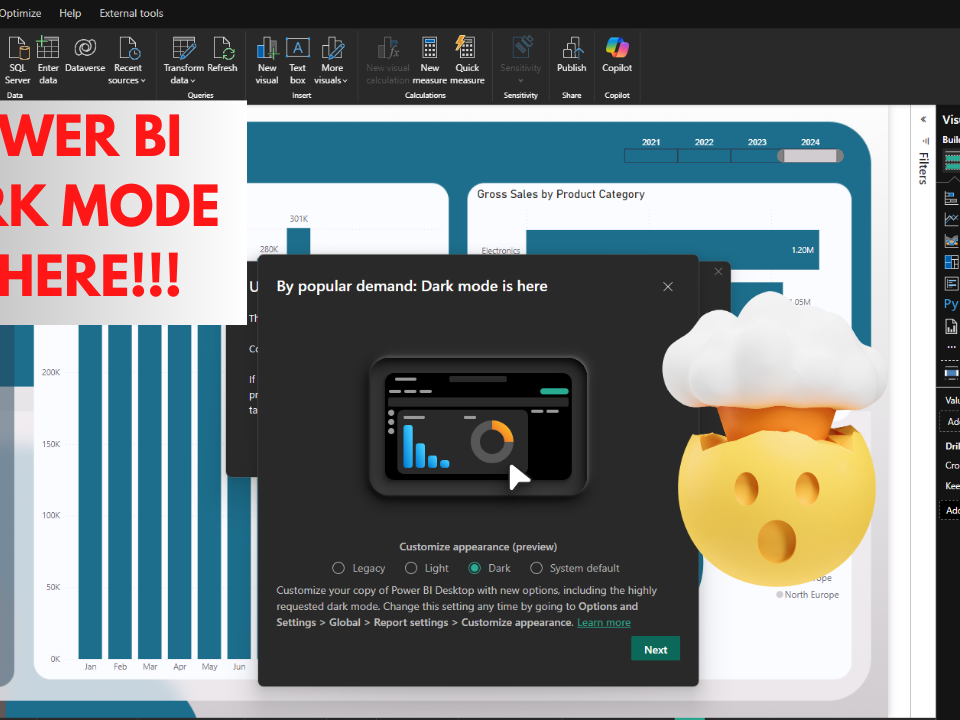
As of 2024, Power BI Desktop officially supports dark mode, a feature users have been eagerly anticipating. This long-awaited update introduces a sleek, modern interface that […]
10/09/2024
Introduction: The August 2024 update of Power BI has brought a game-changing feature to the table: Data Limit. This new capability allows you to set a […]
10/09/2024
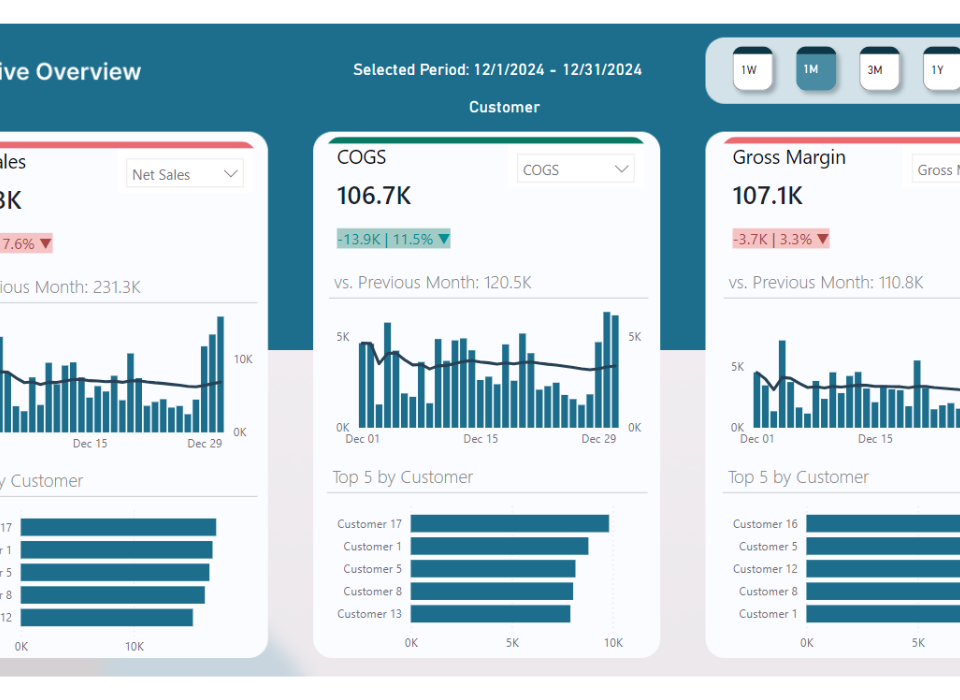
Creating an executive dashboard in Power BI is essential for leaders who want to gain quick and actionable insights into their business performance. An executive dashboard […]
04/09/2024
Power BI ist eine der führenden Plattformen für Datenvisualisierung und Business Intelligence (BI) von Microsoft. Mit Power BI können Benutzer Daten aus verschiedenen Quellen wie Excel, […]
03/09/2024
Introduction When I first decided to learn Power BI back in 2020, I was a complete beginner looking for the best way to get started. I […]
31/08/2024
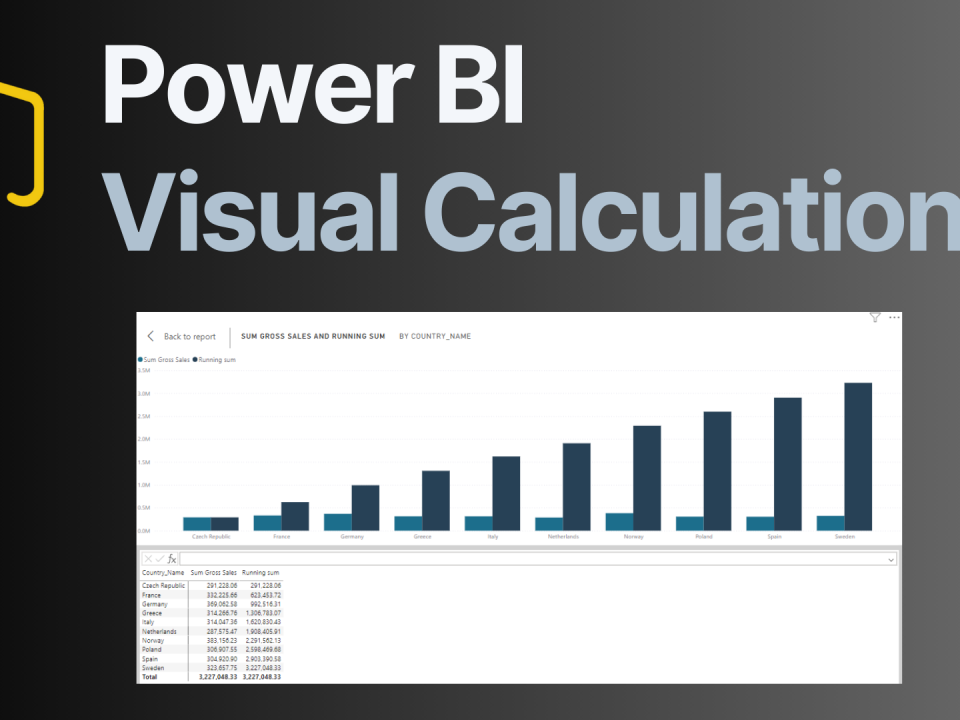
Introduction: Greetings, Power BI users! The February 2024 update brought us a groundbreaking feature: visual calculations in Power BI. This new functionality simplifies the application of […]
30/08/2024
Introduction: Power BI Dashboard Design Ideas: Are you looking to make your Power BI dashboards truly stand out? Designing an eye-catching and effective report isn’t just […]
30/08/2024
Introduction Learning Power BI is an exciting journey. But how long does it take to learn Power BI? It depends on your background, dedication, and the […]

