
Power BI design ideas are what separate a report that gets used from one that gets ignored. Whether you are building your first dashboard or overhauling a report that nobody opens, the right design approach determines whether stakeholders trust your data — or click away. In this guide, I share practical ideas for building beautiful Power BI dashboards, covering layouts, color schemes, UI principles, and backgrounds based on real client work across finance, sales, and operations.
As a freelance Power BI developer, I have built over 30 dashboards from scratch. Consequently, I have seen every design mistake in the book — cluttered canvases, clashing colors, and visuals with zero breathing room. Moreover, I have developed a design-first workflow that begins long before you open Power BI Desktop. So, let’s get into the ideas that actually work.
Turn these design ideas into pages with AI
My free guide shows how I build clean Power BI pages with Claude Code: 25 pages, 7 prompts you can copy, and the PBIP file with a before and after.
How I Build Power BI Reports with AI
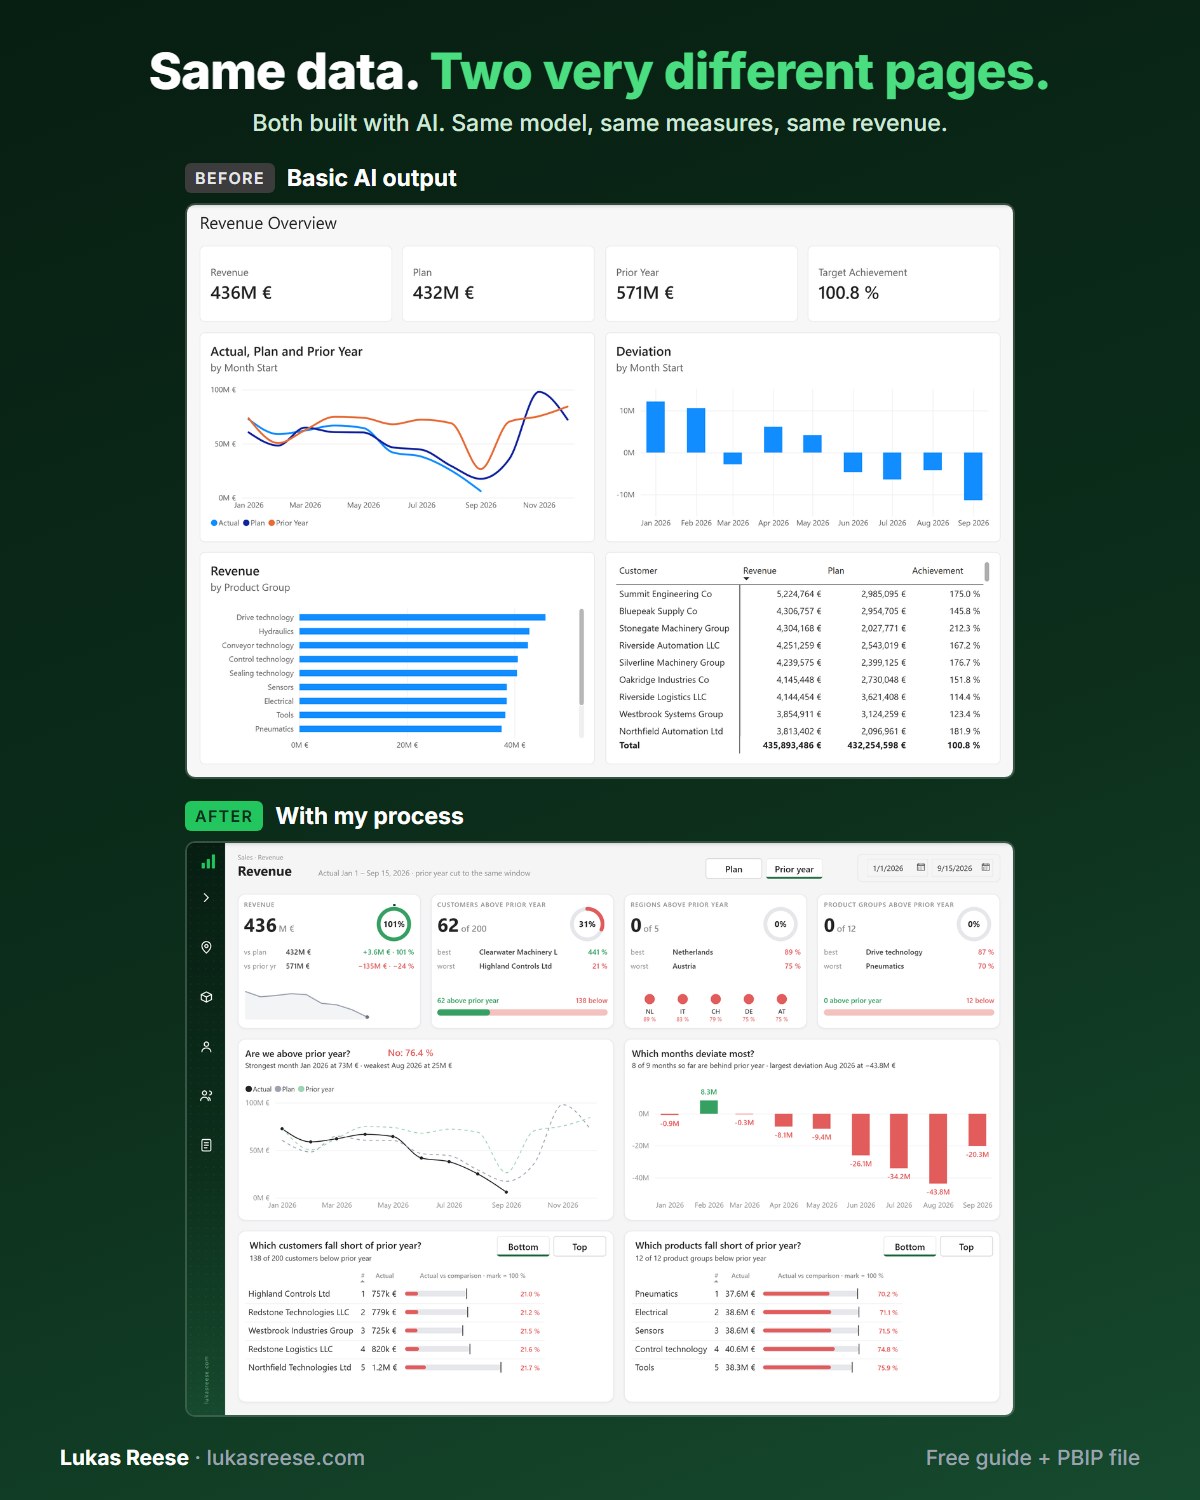
Same data, two very different pages. Both built with AI. This is the process behind the second one.
What you get:
- The 25-page guide: my full process, tool stack and 7 prompts you can copy
- The PBIP file with the same revenue page twice: the basic AI output and the finished page
- Step-by-step explanation, inspiration and real output.
Important: confirm your email
- After you sign up, you get a confirmation email. Click the button in it, then the guide and PBIP file are on their way.
- Good Power BI design starts with layout and color — well before you add a single visual
- The Z-pattern reading flow determines where your most important KPIs belong on the canvas
- Named color themes (Cool Slate, Warm Sand, Navy) produce consistent, professional results without trial and error
- Typography and spacing have more impact on readability than chart type selection
- Dashboard backgrounds set the visual tone of the entire report — design them first, in Figma
- Ready-to-use templates eliminate the blank canvas problem entirely
What Is Power BI Design?
Power BI design is the deliberate set of choices you make about layout, color, typography, visual hierarchy, and background styling when building a report or dashboard. Specifically, it covers both structural decisions (canvas size, layout grid, navigation zones) and aesthetic decisions (color palettes, fonts, backgrounds) that together determine how clear, professional, and trustworthy your report looks.
“A Power BI report that looks cluttered signals cluttered thinking. Design is not decoration — it is the layer that transforms raw output into a genuine decision tool.”
Moreover, design directly affects whether stakeholders trust your numbers. According to Microsoft’s official dashboard design guidance, visual hierarchy and consistent color signals tell the reader where to look and what matters most — and users are significantly more likely to act on insights from a well-structured report compared to an unformatted data export. Additionally, Power BI design has two distinct layers: structural (grid, layout, navigation) and aesthetic (color, font, backgrounds). However, both layers interact — a brilliant color palette placed on a chaotic layout still produces a confusing report.
Power BI Dashboard Layouts: Patterns That Work
Layout is the foundation of any strong Power BI design. Specifically, it determines how quickly users locate what they need — and whether they trust the structure of the report before reading a single number. Research on digital reading patterns consistently shows that users scan screens in a Z-pattern: starting top-left, sweeping right, then diagonally down to the bottom-right. As a result, your most important KPIs always belong in the top-left area of the canvas.

4 Layout Patterns That Work in Practice
In my client work, four layout patterns cover the vast majority of Power BI report pages. Furthermore, each pattern suits a different reporting purpose — choosing the right one before you build saves hours of rework later:
| Layout Pattern | Best For | Structure |
|---|---|---|
| Single Main View | Executive overviews | One dominant chart area + KPI strip |
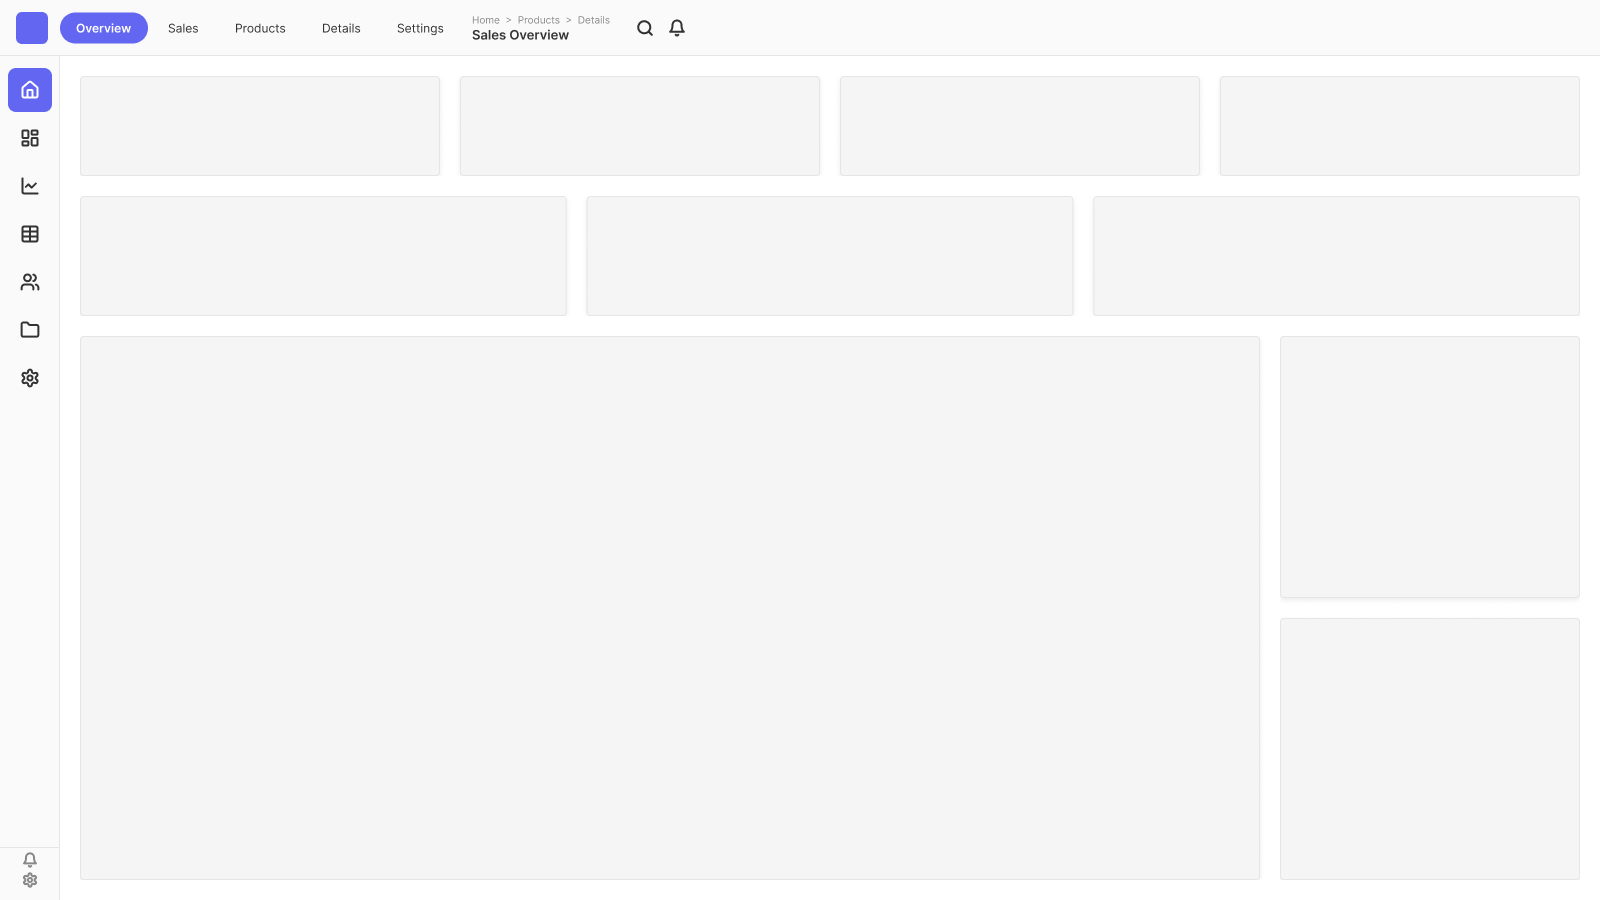
| 2×2 KPI Grid | KPI summary pages | Four equal card zones across the canvas |
| Sidebar + Main | Navigation-heavy reports | Left nav strip + large main content area |
| 2×3 Content Grid | Detail / drillthrough pages | Six equal content zones for dense reports |
The 2×2 KPI grid is particularly effective for executive summary pages. Moreover, it gives each metric enough breathing room to stand on its own without competing with surrounding visuals. The sidebar layout, on the other hand, works well when users need to navigate between multiple report pages without returning to the Power BI Service navigation menu.


For more layout inspiration, additionally check out the 71 Power BI dashboard wireframe examples — they cover every common report structure with annotated mockups you can reference before building.
Power BI Color Schemes: 6 Palettes That Work
Color is one of the most impactful — and most commonly misused — elements in Power BI design. Specifically, the most common mistake I see in client reports is using too many colors, which creates visual noise instead of visual clarity. As a result, a good rule is to limit your palette to four to five colors per report: one dominant background tone, one accent color for key metrics, and two to three supporting shades for charts.
6 Named Color Themes With Visual Examples
Rather than picking colors from scratch each time, I recommend starting with a named theme. Consequently, every design decision — background, text color, chart palette — flows from one coordinated set of values. Here are six themes I use regularly with clients, based on the color presets in the Power BI Background Designer:

| Theme Name | Base Tone | Best For |
|---|---|---|
| Cool Slate | Blue-grey | Corporate, finance, operations |
| Clean White | Off-white / light grey | Internal tools, data-heavy detail pages |
| Navy | Deep navy blue | Executive presentations, sales dashboards |
| Warm Sand | Beige / warm neutral | HR, customer-facing, retail reports |
| Pacific Blue | Mid blue | Tech, logistics, healthcare |
| Dark Charcoal | Near-black | Dark mode, boardroom presentations |


Applying Your Color Theme in Power BI
Once you have chosen a color scheme, you can apply it through Power BI’s built-in theme editor. Specifically, go to the View tab → click the expand icon → select Customize current theme. There, you can configure chart colors, font colors, background tone, and much more — all saved as a reusable theme that applies across the entire report.
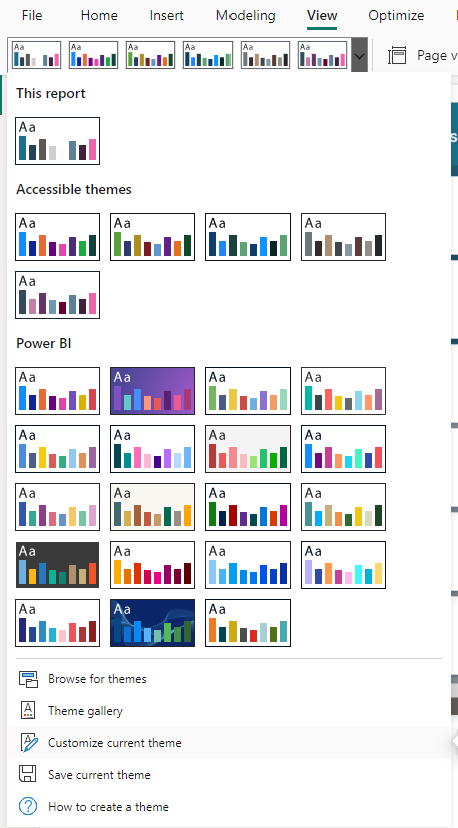
Alternatively, you can export and edit a Power BI JSON theme file to apply your palette consistently — including chart defaults, card styles, and text formatting — without touching the theme editor every time you create a new report. Additionally, for dark mode report designs specifically, the Power BI dark mode templates guide walks through the full dark palette setup.
Power BI User Interface Design: Typography & Spacing
Typography and spacing are the most underrated elements of Power BI user interface design. Specifically, a dashboard with exactly the right charts but poor font choices and tight spacing will always feel amateurish — regardless of the data quality beneath it. In my experience, fixing the font hierarchy and adding consistent padding between visuals has more visual impact than swapping chart types.
Font Recommendations for Power BI
For most Power BI reports, Segoe UI is the right default choice. It is Microsoft’s own system font, renders cleanly at small data-label sizes (10–12pt), and feels naturally at home inside the Power BI interface. Furthermore, it requires no installation — every Windows machine already has it, so your report will render correctly in the Power BI Service without fallback issues.
For IBCS-style financial reports or more structured dashboards, DIN or Source Sans Pro are strong alternatives. However, always verify that a custom font is installed on all viewer machines or embedded in your Power BI theme file — otherwise the report silently falls back to the system default.
Size Hierarchy That Works
A clear size hierarchy guides the eye from the most important information to the supporting detail. In practice, I use this scale consistently across all reports:
| Element | Size | Weight |
|---|---|---|
| Page title | 24–28 pt | Bold |
| Section label | 14–16 pt | Semibold |
| KPI value | 24–40 pt | Bold |
| Body / data labels | 10–12 pt | Regular |
Spacing Rules That Matter
“The most common Power BI UI mistake I see is zero padding between visuals. Even excellent data looks amateurish when charts are jammed edge-to-edge — whitespace is not wasted space, it is structure.”
Specifically, apply a minimum of 8 pixels of padding between all visuals on the canvas. Furthermore, use Power BI’s Snap to grid setting (View → Snap objects to grid) to ensure consistent alignment without manually pixel-nudging each visual. Additionally, group related visuals into clearly defined visual zones — for example, all KPI cards in one horizontal strip, all trend charts in the section below. In particular, this grouping is what gives a dashboard a sense of intentional structure rather than elements scattered across a blank canvas.
Power BI Design Inspiration: Where to Look
Finding fresh Power BI design inspiration is easier than most developers expect. Specifically, some of the best sources are outside the Power BI ecosystem entirely — because great dashboard design borrows freely from product UI, data journalism, and print layout principles. In particular, looking beyond Power BI galleries forces you to think about design as a discipline rather than a checklist of Power BI features.
My go-to inspiration sources:
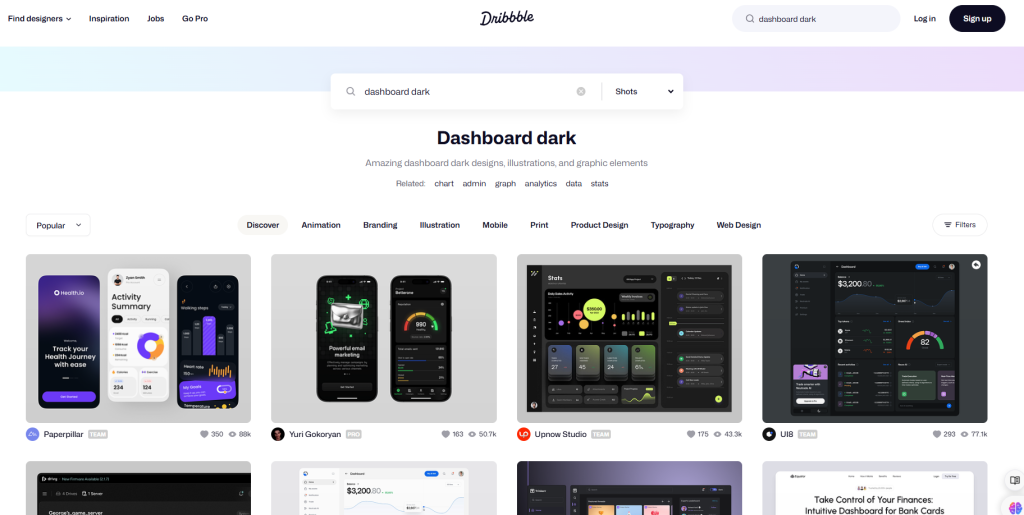
- Dribbble — search “dashboard dark” or “KPI dashboard” for high-quality UI references. Moreover, filtering by “Data visualization” surfaces what professional designers are building with data layouts today.
- Microsoft Power BI samples — specifically, the official Power BI sample datasets include fully designed reports for retail, HR, and financial scenarios — all downloadable as .pbix files.
- 71 dashboard wireframe examples — additionally, the 71 Power BI wireframe examples on this site cover every common report structure with annotated mockups.
- Dashboard UI inspiration guide — furthermore, the dashboard UI design inspiration guide collects the best external references organized by industry and use case.
Additionally, for pure color palette inspiration, Color Hunt is excellent — their trending palettes section shows current design preferences, and you can lift hex codes directly for your Power BI JSON theme file. Specifically, searching for “professional” or “corporate” palettes on Color Hunt returns coordinated four-color sets that translate directly into a Power BI theme without further adjustment.
Dashboard Backgrounds: The Most Overlooked Design Element
The background is the single most impactful design element in a Power BI report — and the most commonly skipped. Specifically, a well-designed background defines the layout grid, establishes the color tone, and gives every visual a professional container to sit inside. In contrast, a plain white or default grey background forces each visual to compete for attention without any structural support.
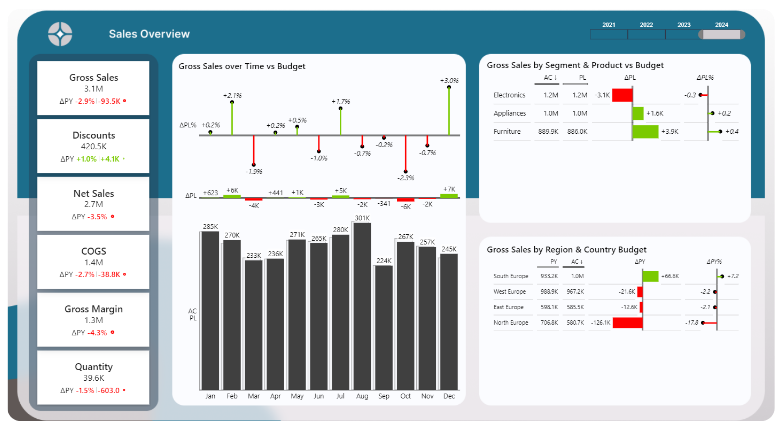
Backgrounds are the most overlooked piece — and the easiest to automate.
Here’s the Background Designer Figma plugin generating one of the layouts shown above. No more manual rectangles or guesswork.
In my client work, the background is always the first thing I design. Moreover, once the background is in place, every subsequent design decision — chart colors, KPI card style, font size — follows naturally from it rather than being invented from nothing each time.
Creating Power BI Backgrounds with the Background Designer Plugin
The fastest way to create a professional Power BI dashboard background is with the Power BI Background Designer — a Figma plugin I built specifically for this workflow. Specifically, the plugin lets you select a layout grid, choose a named color preset, and export a pixel-perfect PNG background at the correct canvas dimensions — in under a minute, with no design experience required.


Additionally, for a broader look at background creation methods, the Power BI background image guide covers every approach — from SVG shapes to full PNG exports — with instructions for each. Furthermore, if you want to compare methods side by side, four ways to create Power BI backgrounds breaks down the trade-offs clearly.
Power BI Design Templates: Skip the Blank Canvas
The blank canvas problem is one of the most consistent friction points in Power BI report building. Specifically, starting from scratch — with no layout grid, no color palette, and no visual structure — is precisely where most design mistakes get locked in early. A good template solves this by giving you a tested, professional starting point that you adapt rather than invent.

The Power BI Dashboard Background Templates library includes layout backgrounds in multiple named color themes — each exported at the correct Power BI canvas dimensions and ready to set as a background image in Power BI Desktop. Moreover, templates are available in both light and dark mode variants, so you can match your organization’s preferred style without starting from zero each time.
Specifically, a complete Power BI design template includes: a background PNG sized to your canvas, a color theme JSON file for chart palette consistency, and a layout guide that shows exactly where each visual zone sits on the grid. Furthermore, for guidance on how to use these templates effectively inside a full report-building workflow, the Power BI dashboard design best practices guide walks through the process step by step.
Ready to build your first beautiful Power BI report?
Generate a professional dashboard background in under a minute — layout grid, color preset, and correct canvas size included.
Frequently Asked Questions
▶ What is Power BI design?
Power BI design refers to the deliberate choices you make about layout, color scheme, typography, and visual hierarchy when building a report or dashboard. Specifically, it covers both structural decisions (canvas size, layout grid, navigation placement) and aesthetic choices (colors, fonts, backgrounds) that together determine how clear and professional the report looks and feels. In particular, good Power BI design reduces the cognitive load on the reader — making insights faster to find and easier to trust.
▶ How do I make my Power BI dashboard look professional?
To make a Power BI dashboard look professional, start with a consistent color theme of four to five colors, use a background image to define the layout grid, and apply a clear font hierarchy — larger sizes for page titles, smaller for data labels. Moreover, add at least 8 pixels of padding between all visuals and use Power BI’s Snap to grid feature for consistent alignment. Specifically, design the background before placing any visuals — this single step prevents the cluttered, unplanned look that makes most Power BI reports feel amateurish.
▶ What colors work best for a Power BI dashboard?
The best colors depend on the reporting context. However, as a general rule, corporate and financial reports work well with Cool Slate (blue-grey) or Navy palettes, customer-facing reports suit Warm Sand or Clean White, and executive boardroom presentations benefit from Dark Charcoal. Specifically, avoid using more than five colors in a single report — each additional color adds cognitive load and reduces visual clarity. Additionally, always assign one consistent color to positive indicators (green) and one to negative indicators (red) and use them exclusively for those meanings throughout the report.
▶ What font should I use in Power BI?
Segoe UI is the best default font for Power BI dashboards. Specifically, it is Microsoft’s own system font, renders cleanly at small sizes (10–12pt for data labels), and requires no installation — making it safe for the Power BI Service. For IBCS-style financial or structured analytical reports, DIN or Source Sans Pro are strong alternatives. However, when using custom fonts, verify they are installed on viewer machines or embedded in a Power BI JSON theme file — otherwise the report silently falls back to a system default.
▶ How do I create a background for my Power BI dashboard?
There are several ways to create a Power BI dashboard background. Specifically, you can design one in Figma and export as PNG, build shapes directly in Power BI using SVG images, use PowerPoint as a layout canvas, or use the Power BI Background Designer Figma plugin to generate a pixel-perfect background automatically. In particular, the Background Designer is the fastest approach — it handles canvas sizing, layout grid definition, and color preset selection in a single workflow, so you can focus on building the report rather than the design scaffolding.
▶ Where can I find Power BI design inspiration?
The best sources for Power BI dashboard design inspiration include Dribbble (search “dashboard dark” or “KPI dashboard”), the Microsoft Power BI sample reports gallery, and this site’s 71 dashboard wireframe examples. Additionally, Color Hunt is excellent for finding coordinated color palettes you can directly apply to your Power BI JSON theme file. Moreover, looking beyond the Power BI ecosystem — at product UI on Dribbble or data journalism layouts — often yields the most original and differentiated design ideas.
About the author: Lukas Reese is a freelance Power BI developer and dashboard designer working remotely with clients across Europe and the US. He has built over 30 Power BI reports across finance, sales, and operations, and created the Power BI Background Designer to solve the blank canvas problem faster.