
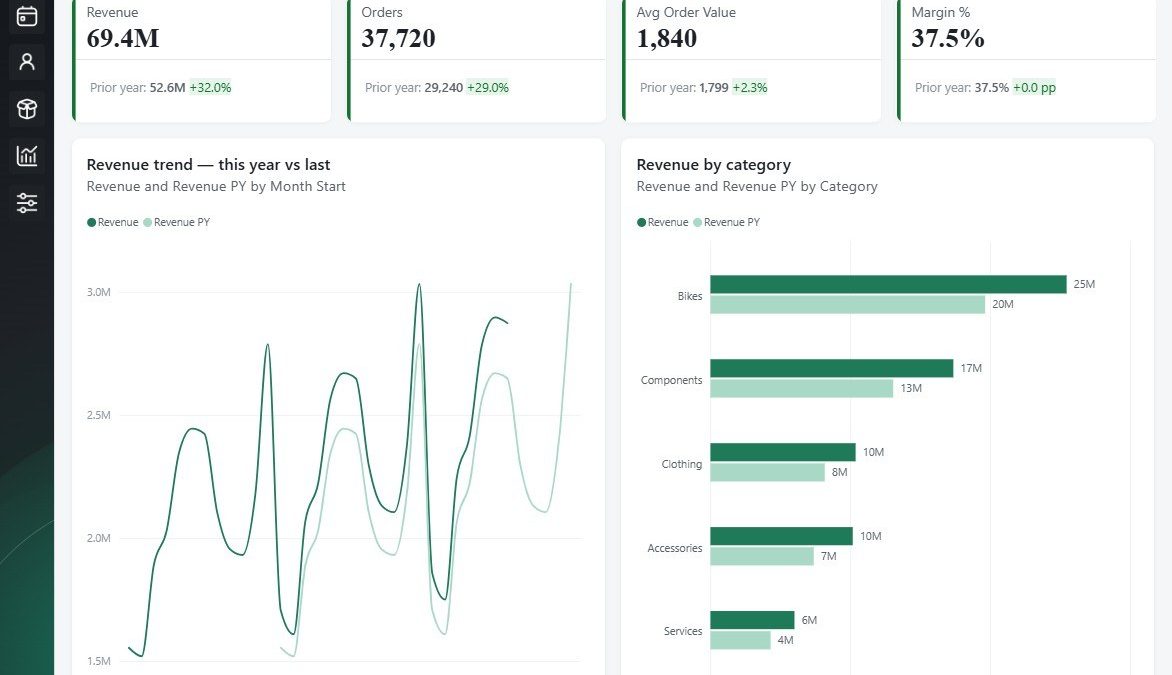
A Power BI background SVG is a vector image you place behind the report canvas to define the layout — the card shapes, the header bar, the sidebar, the dividing lines. Crucially, an SVG is plain text, not pixels. Consequently, an AI model can write one directly, which changes how these backgrounds get made.
This guide covers what an SVG background actually is, why the format matters once AI is in the loop, and the exact workflow I use to get from a reference image to a finished background. Additionally, it covers the route that needs no AI at all, for anyone who would rather click than prompt.
From background to finished report page
My free guide covers the background step and every step around it, from mock-up to PBIP: 25 pages, 7 prompts you can copy, and the PBIP file.
- A Power BI background SVG is a text file describing shapes, not a picture of them.
- Because it is text, an AI model can write and edit it directly — no image generator involved.
- Above all, build to your exact canvas size, usually 1280 × 720 or 1600 × 900.
- Set Image fit to Fit and transparency to 0%, or the background will not look right.
- Similarly, export PNG for gradients and soft shadows. Use SVG for flat geometry.
- If you would rather not prompt at all, a Figma plugin does the same job in five settings.
What is a Power BI background SVG?
An SVG, or Scalable Vector Graphic, is an image format that stores shapes as instructions instead of pixels. A rectangle is a line of markup with an x, a y, a width, a height and a fill colour. As a result, the file scales to any size without blurring, and it stays editable forever.
A Power BI background SVG sits behind everything on the page, in the slot Power BI calls the canvas background. It carries no data and it is not interactive — it is purely the frame your visuals sit inside. However, it does more work than almost any other design decision on the report, because it establishes the grid, the spacing and the visual hierarchy in one go.
Your Power BI background is not a picture. It is a text file that happens to look like one.
Use a language model, not an image model. An image generator paints something that resembles a grid; a language model writes the grid.

If backgrounds in general are new to you, start with four ways to create Power BI backgrounds, which compares the approaches end to end. This article goes deep on one of them.
Why a Power BI background SVG suits AI so well
Here is the part most people miss. Image generators are the obvious tool for making pictures, and they are the wrong tool for making a Power BI background SVG.
The distinction is not pedantic. Consequently, it decides which model you reach for and how much control you keep.
An image model produces pixels. Consequently, you get something that looks close but has soft edges, inconsistent spacing and card widths that never quite line up with a grid. Furthermore, you cannot edit it — changing one colour means regenerating the whole image and losing everything else.
A language model, in contrast, writes the SVG markup itself. Therefore the rectangles land on exact coordinates, the corner radii are identical, and the colours are the literal hex values from your brand palette. Above all, you can ask for a change and get a change, not a new picture.
What that looks like in practice
“Move the sidebar from 60 to 80 pixels wide and shift everything right” is a trivial instruction against markup. Against a generated image, it is impossible. Similarly, “use #22C55E instead of blue for the accent bar” either happens exactly or it does not happen at all.
This is the same reason report layouts became automatable once Power BI moved to the PBIR format. Text is editable, binaries are not. The background layer and the report layer both benefit from exactly the same shift.
Power BI background SVG vs PNG: which to ship
A Power BI background SVG and a PNG both work, and the honest answer is that I use both. Specifically, the choice depends on what the design contains rather than on which format is better.
| SVG | PNG | |
|---|---|---|
| Editable later | Yes, it is text | No, re-export needed |
| AI can write it directly | Yes | No |
| Flat shapes and grids | Excellent | Fine |
| Complex gradients and shadows | Can render unpredictably | Reliable |
| File size | Tiny for simple layouts | Larger, fixed |
| Safest choice | Author in SVG | Ship as PNG |
My rule is simple: author in SVG, ship whichever format renders correctly. Power BI Desktop accepts SVG for the canvas background alongside PNG and JPG, but its SVG rendering is less forgiving than a browser’s. Consequently, for gradient-heavy designs I export the finished SVG to PNG and upload that instead.
From prompt to Power BI background SVG
This is the loop I use to produce a Power BI background SVG. Notably, it takes minutes rather than the half hour a manual Figma build costs me.
To make it concrete, here is how the background behind the report in this article came about. First of all, I opened Claude Design, turned off the design system, and started a new wireframe. Then I gave it two screenshots: one of the report I liked, and one of my own so it could match the existing look. Additionally, I told it to use the green theme I was already running, and asked for a few variations.
A couple of minutes later I had options. Notably, the first one was not bad, so I took it — you can wait around for more, but I rarely do. Finally it is share, export as PNG, select the whole frame, and download.
Step 1 — start from a reference, not a blank prompt
Describing a layout in words is slow and imprecise. Instead, I hand over a screenshot: a report I like, a wireframe, or the existing page I am replacing. A picture removes ten rounds of clarification in one step.
Step 2 — state the canvas size first
Every coordinate depends on this, so it goes in the first sentence. For example: “Build a 1600 × 900 Power BI background SVG.” Getting this wrong means everything is subtly off, which is why the canvas size guide is worth five minutes before you start.
Step 3 — give the palette as hex values
Never say “dark green”. Say #071E12 for the base and #22C55E for the accent. In effect, the exactness is the whole advantage of working in markup, so use it.
Step 4 — describe the regions, not the decoration
List the structural blocks: header height, sidebar width, how many KPI cards, how many chart containers, the gutter between them. Furthermore, ask for the card rectangles to be flat with a single corner radius. Decoration can come later; the grid cannot.
Step 5 — look at it, then iterate
Open the SVG in a browser and check the seams. Typically two rounds fix everything: one for spacing, one for colour. Similarly, if you are already working inside Power BI, an agent connected through the Power BI Desktop Bridge can apply the background and screenshot the rendered page itself. Microsoft documents that feature in What is the Power BI Desktop Bridge.
Step 6 — export and apply
Save the SVG. If the design leans on gradients or soft shadows, export a PNG at the same dimensions as well, then apply whichever one renders correctly in Desktop.
How to add a Power BI background SVG in Desktop
Applying it takes four clicks, and two of the settings catch people out every time.
- First of all, click on empty canvas so nothing is selected, then open the Format pane.
- Then expand Canvas background.
- Click Browse and pick your SVG or PNG.
- Finally, set Image fit to Fit and drag Transparency to 0%.
Note the difference between the Power BI canvas background and the Wallpaper. Canvas background covers the page area only. Wallpaper fills the space around it in the Service, so a report on a wide monitor does not sit on grey. For a polished result, set both.
The transparency trick
Once the background carries the card shapes, the visuals sitting on top of them should not draw their own. Otherwise you get a card inside a card, with two slightly different greys and two slightly different corner radii.
Notably, there is a quick way to check whether you have done this correctly. Simply set the canvas background transparency to 100%. If the page goes almost empty and you are left with bare charts floating on white, the background is doing the work and the visuals are clean. If every chart still sits in its own grey box, you have two card layers stacked.
Therefore, the fix is to strip the visual’s own container. For each visual, turn off Background, turn off Border, and turn off the Shadow. As a result, the visual becomes a floating chart and the background image supplies the entire frame.
If the background draws the card, the visual must not. Two cards stacked is the single most common Power BI design tell.
There is a second use of transparency worth knowing. An SVG can contain fully transparent regions, so you can layer a decorative overlay above a photographic wallpaper and keep both. In practice I rarely need it, but it is there.
The harder half is choosing what goes in the frame and building a model that answers the question. DataCamp runs hands-on Power BI, DAX and data visualisation courses, and new users get a discount on their first subscription.
Explore DataCamp courses →Where an AI-written Power BI background SVG falls down
Generating a Power BI background SVG this way is genuinely fast, but it is not magic. Here is where it still costs me time.
- Text inside the SVG. Specifically, fonts are not embedded, so a label that looks right on your machine can shift on someone else’s. Keep text in the report, not in the background.
- Gradients render differently. Power BI’s SVG support is narrower than a browser’s, and complex gradient stops are the usual casualty. Export to PNG when it matters.
- The model does not know your data. For example, it will happily give you six KPI card slots when your page needs four.
- Taste is still yours. In effect, it can produce a clean grid. It cannot tell you the grid is the wrong shape for the story.
- Round-tripping degrades. Notably, ten edits in, the markup gets messy. Regenerating from a clean prompt often beats patching.
None of these are dealbreakers. However, anyone promising a finished, on-brand dashboard from a single prompt is selling something.
The route with no AI at all
Admittedly, prompting is not the only way, and for many people it is not the best way. If you want a background in thirty seconds with no iteration, a generator beats a conversation.
I built the Power BI Background Designer for exactly this. It is a Figma plugin that produces a pixel-perfect Power BI dashboard background from five settings — grid layout, navigation, KPI cards, style and colour — and exports to PNG, JPG or SVG. Because the output is a native Figma frame, you can also open it up and change anything by hand.
It is not the only option, and I would rather point you at the alternatives than pretend otherwise. There is a free open-source Power BI SVG background generator at Zerg00s/Power-BI-Backgrounds that lets you pick a layout, set a colour scheme and download the SVG directly.
Both routes end in the same place: a Power BI background SVG or PNG you upload to the canvas background. Choose whichever suits how you like to work. For the full comparison, including the manual PowerPoint and Figma methods, see the Power BI background image guide, and the dark mode templates if you want ready-made files.
Where the AI route pays off most
Honestly, it is not the first background. It is the twelfth variation of the same background, or a background that has to match a client’s brand book exactly. Similarly, it pays off when the background and the report are being built together — an agent working through the Power BI Desktop Bridge can generate the background, apply it, and then align every visual to it without you touching the mouse. Microsoft documents the bridge itself in What is the Power BI Desktop Bridge, and the whole toolchain sits in the report authoring skill.
Frequently asked questions
Does Power BI support SVG backgrounds?
Yes. Power BI Desktop accepts SVG for the canvas background alongside PNG, JPG, GIF and BMP. However, its SVG renderer is stricter than a browser’s, so complex gradients and effects can look different. When a design relies on those, export the same file to PNG and upload that instead.
Why is my Power BI background image not showing?
Almost always the transparency slider. Power BI sets canvas background transparency to 100% by default, which hides the image completely. Set it to 0%. If it still looks wrong, check that Image fit is set to Fit and that the file dimensions match your canvas size.
Can ChatGPT or Claude generate a Power BI background SVG?
Yes, and this is the right tool for the job. A language model writes the SVG markup directly, so shapes land on exact coordinates and colours are literal hex values. An image generator produces pixels that only approximate a grid, which is why image models are the wrong choice here.
More questions about this
What size should a Power BI background be?
Match your canvas exactly. The default 16:9 page is 1280 × 720, and 1600 × 900 is a common step up for denser reports. Build the background at the same pixel dimensions, then set Image fit to Fit so Power BI does not scale it.
Should the background or the visual draw the card?
Pick one, never both. If the background image contains the card shapes, turn off each visual’s own background, border and shadow. Two stacked cards with slightly different greys is the most common giveaway of an unpolished report.
Where to go next
If you want the fastest possible result, use the Background Designer and skip the prompting entirely. If you want the background and the report built together by an agent, start with the Power BI Desktop Bridge instead.
Last updated 18 August 2026. Written by Lukas Reese, a freelance Power BI consultant working with clients in Germany and the US on data modelling, DAX and dashboard design.