

The Power BI Desktop Bridge is a local server that runs inside Power BI Desktop and lets an external tool talk to your open report. Specifically, it lets an AI agent read what file is open, reload it after an edit, and capture a screenshot of any page. However, that plain description badly undersells what actually changed.
I have been editing Power BI reports as project files for a while, so AI writing a report was not new to me. What was missing was feedback. The model wrote the JSON, I opened Desktop, I found what was wrong, and I described it back in words. The bridge removes that middle step, and it mattered far more than I expected.
Below: what the bridge is, how to switch it on, what changed in my own work, and where it still falls short.
The Desktop Bridge in a complete workflow
My free guide shows the 8 steps around the bridge, from reference report to finished page: 25 pages, 7 prompts you can copy, and the PBIP file.
- A local server inside Power BI Desktop that lets AI agents reload files and take screenshots.
- In preview. Needs Power BI Desktop 2.155.756.0 or later.
- It needs a .pbip project. A .pbix will not work.
- It closes the loop: write, look, judge, fix.
- All of it is free.
- It handles mechanics, not judgement.
What is the Power BI Desktop Bridge?
The Power BI Desktop Bridge is a local server hosted inside the Power BI Desktop process. It exposes a small API to other applications on the same machine. In effect, external tools and AI agents can inspect the open report, reload it from disk, and take screenshots for validation.
Microsoft ships it as part of its Power BI agentic capabilities, and it is currently in preview. Consequently, the behaviour and the API surface may still change before general availability.
Power BI Desktop Bridge: the technical facts
Notably, the bridge is deliberately small and deliberately local. For example, there is no cloud component and no remote endpoint to secure.
| Fact | Detail |
|---|---|
| Transport | Named pipe, pbi-desktop-bridge-{processId} |
| Protocol | JSON-RPC 2.0 with Content-Length framing |
| Remote access | Not supported. Therefore it is local only. |
| Multiple windows | Each open Desktop window gets its own independent pipe |
| Concurrency | One operation at a time. As a result, a second request during a running one returns an error. |
| Cost | Free, and on by default in recent builds |
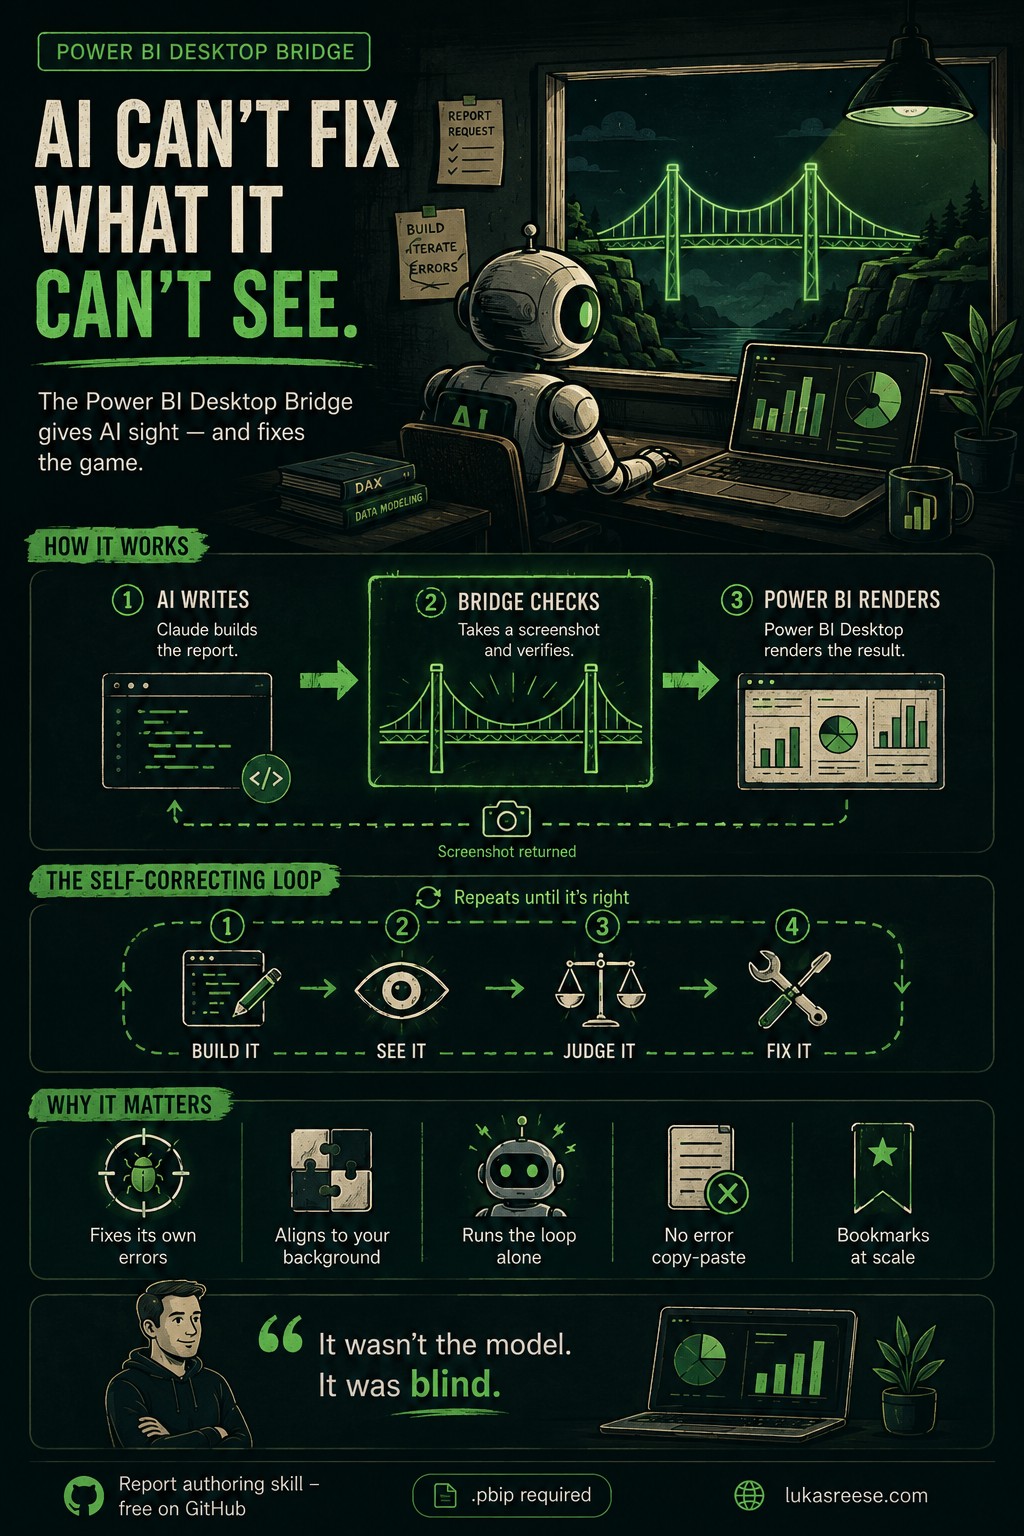
The Power BI Desktop Bridge does not make the model smarter. Rather, it gives the model eyes.
What actually changed, and why I ignored this for a while
Power BI project files are nothing more than JSON code. Save a report as a .pbip and every page, every visual, every bookmark sits on disk as plain text. That has been true for a while. In principle, therefore, a language model could always write a Power BI report.
My first attempt: it worked, and I still put it down
I tried exactly that early on. I opened a project, pointed a model at the report JSON, and asked it to build pages for me. To be fair, it worked. Visuals appeared, properties were set, nothing exploded.
However, I did not like the structure of what came back. Nor did I like how the whole thing felt to work with. It was not a workflow I wanted to live in every day, so I went back to clicking and left it alone.
That is a less dramatic story than “AI failed”, but it is the honest one. The technology was capable. The experience was not good enough to change how I worked.
Then Microsoft shipped the skills
Then Microsoft published a set of first-party agent skills for Power BI and put them in a public repository. Report authoring, report design, report planning, semantic model authoring. Suddenly the agent was not guessing at the schema any more.
Instead it had a long, detailed document describing how a Power BI project file actually works. That document carries references for the awkward parts too, such as bookmark panels and conditional formatting expressions.
The report authoring skill is the one I use most. Above all, though, the piece that changed the game is bundled inside it and is easy to miss.
The bridge is not a skill — it is a feature
The Power BI Desktop Bridge is not really a skill at all. Rather, it is a feature that ships alongside the report authoring skill. All it does is let Claude take screenshots of your report and verify the result.
That sounds small. In practice it is the entire difference. If something is broken, Claude can now see it and fix it iteratively, instead of handing you a file and hoping.
It was never the model. It was blind.
I finally had a free afternoon to test the whole thing properly, on a real report rather than a toy one. Consequently, everything below comes from that session — including the parts that did not go smoothly.
How the Power BI Desktop Bridge works: write, look, judge, fix
The Power BI Desktop Bridge turns that one-way street into a loop. In particular, the agent can now check its own work before handing it back to you.
- Write. First of all, the agent edits the PBIR JSON on disk — pages, visuals, filters, formatting, theme.
- Look. It calls the bridge to reload the file in Power BI Desktop and capture a PNG of the page.
- Judge. Then it reads that screenshot and compares the render against what you asked for.
- Fix. Where the render is wrong, it edits again and repeats. Accordingly, the loop runs until the page matches.
The four methods the Power BI Desktop Bridge exposes
Similarly, the API surface is small on purpose. Additionally, an agent is expected to call the manifest first rather than guess at method names.
| Method | What it does |
|---|---|
bridge.manifest | Returns every supported method with its input and output schema. Consequently, the agent never calls something that does not exist. |
application.state.get/v1 | Reports which file is open and whether it has unsaved changes. In effect, it is a safety check before anything destructive. |
report.snapshot.capture/v1 | Captures one page as a PNG at a scale factor between 1.0 and 3.0. Above all, this is the method that gives the agent sight. |
file.reload/v1 | Reloads the open PBIP file from disk, optionally re-applying the semantic model definition. |
Full parameter details sit in the Microsoft Learn documentation for the Desktop Bridge. For most people, however, the command line wrapper is easier than the raw API.
How to enable the Power BI Desktop Bridge
Overall, setting up the Power BI Desktop Bridge takes about ten minutes, and every component is free. Below is the exact sequence I use.
What you need for the Power BI Desktop Bridge
- Power BI Desktop, specifically build 2.155.756.0 or later — the June 2026 release or newer.
- Node.js 18 or later, since both command line tools are npm packages.
- An AI coding agent. I use Claude Code. Similarly, GitHub Copilot CLI, VS Code Copilot, Cursor, Codex and Windsurf are supported.
- A report saved as .pbip. This one is not optional, as the next section explains.
Step 1 — turn on the preview feature
Notably, the setting is not called “Desktop Bridge” anywhere in the interface, which is why people miss it. Instead, look for this exact wording:
- Open Power BI Desktop.
- Go to File > Options and settings > Options.
- Select Preview features.
- Tick Enable external tool access to Power BI Desktop through secure local APIs.
In recent builds it is already on by default. Nevertheless, it is worth confirming before you blame the agent for something the toggle caused.
Step 2 — install the two command line tools
In effect, two separate npm packages do two separate jobs. Specifically, one drives Desktop and the other validates the report files.
npm install -g @microsoft/powerbi-desktop-bridge-cli
npm install -g @microsoft/powerbi-report-authoring-cli
Both are published by Microsoft on npm — see the Power BI Desktop Bridge CLI package for the full command reference.
The Power BI Desktop Bridge CLI gives you the powerbi-desktop command with status, manifest, open, reload, screenshot and screenshot-all. The second gives you powerbi-report-author, which validates PBIR before you ever open Desktop.
Step 3 — install the report authoring skill
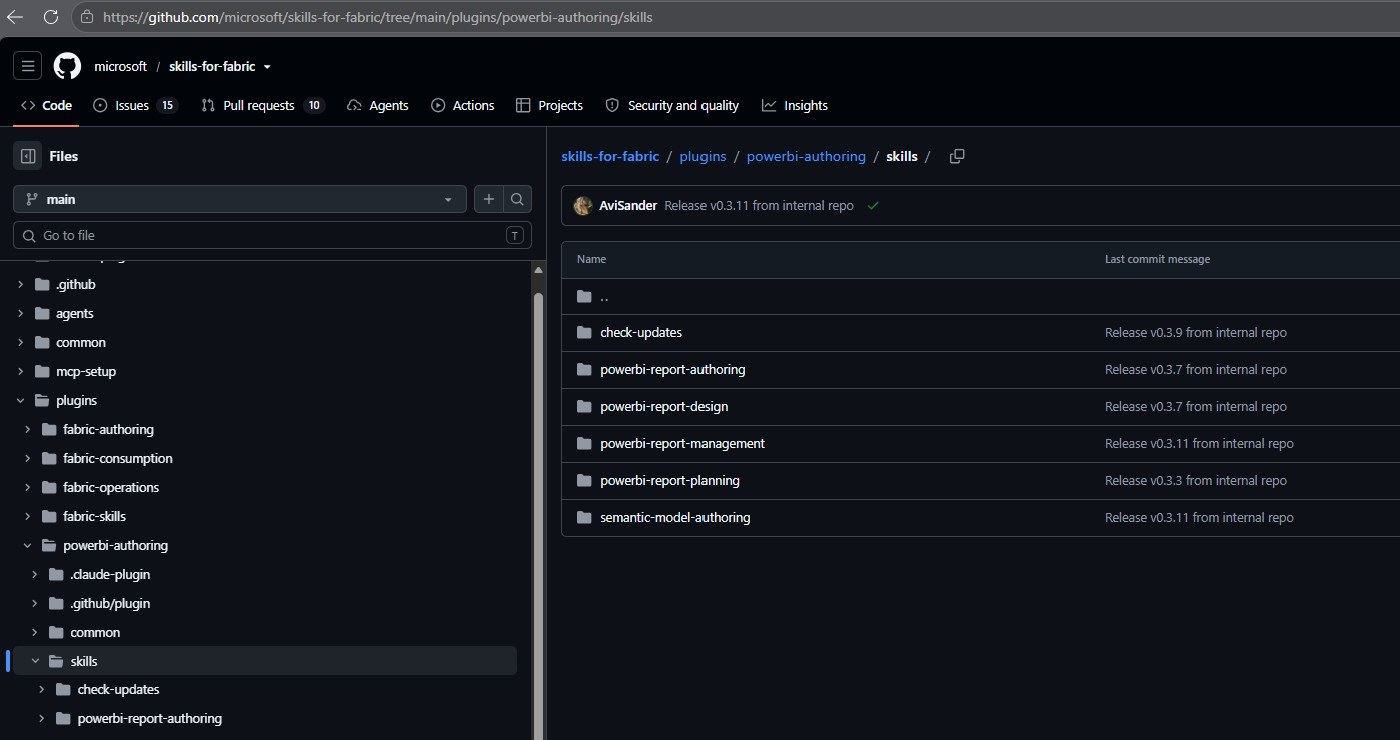
The bridge on its own is just plumbing. Furthermore, the agent needs to know how PBIR is structured, and that knowledge ships in Microsoft’s Skills for Fabric repository.
copilot plugin marketplace add microsoft/skills-for-fabric
copilot plugin install powerbi-authoring@fabric-collection
The plugin bundles the report authoring, report design, planner and management skills, plus the Power BI Modeling MCP server. I cover the whole repository in the guide to the Power BI report authoring skill.
Step 4 — check the Power BI Desktop Bridge is live
First of all, open a PBIP project in Power BI Desktop, then run the status command. Afterwards, capture every page as a sanity check.
powerbi-desktop status
powerbi-desktop screenshot-all
If status lists your file path and your PBIR pages, the Power BI Desktop Bridge is live. Otherwise, check the preview toggle first and the Node version second.
Why your report has to be a .pbip file
This is the single most common reason people bounce off agentic Power BI, so it is worth stating plainly. Microsoft’s own documentation puts it in one line: “The skill works only with PBIP files.”
PBIP (Power BI Project) is a save format that writes your report and semantic model to a folder of readable text files instead of one binary container. PBIR (Power BI Enhanced Report Format) is the report half of that folder, where each page and each visual is stored as its own JSON file.
A .pbix file is a single compressed container. Consequently, an agent cannot open it, cannot diff it, and cannot edit one visual without rewriting the whole file. Converting takes one step: File > Save as > Power BI project.
One setting decides whether AI can touch your report: save it as a .pbip.
If the difference between the formats is new to you, I broke it down in PBIX vs PBIR vs PBIP. Similarly, Power BI just became a code-first tool covers why this shift matters beyond AI, and TMDL does the same for the model layer.
Five things the Power BI Desktop Bridge unlocks
Specifically, here is what changed in my week-to-week work. Notably, none of these are hypothetical — each one came out of building a real client-style report.
1. It catches its own errors
A broken visual, a wrong colour, a card sitting four pixels off the grid. Previously those were mine to find, which meant opening Desktop, spotting the problem, and writing a sentence describing it. Now the agent reloads the page, captures a PNG, looks at it, and fixes the obvious failures before I ever open the file.
Watching it happen side by side is genuinely odd the first time. Power BI Desktop is being operated by something that is not me. The file reloads, a screenshot gets taken on purpose, and the agent checks whether the page is really rendering rather than assuming it is.
2. Alignment became a sentence
Above all, this is the one I did not expect. “Align every visual pixel-perfect to my background image” used to be an hour of nudging things half a pixel at a time. In effect, it is now one instruction, executed and then checked against the actual render rather than against the JSON.
On my own report that produced a gradient running from the collapsed icon rail into the expanded panel, with the waves and the divider lines landing exactly where they should. I will be blunt: that is something I could not have done myself, at least not in a sensible amount of time.
That matters because a Power BI background is just an image behind the canvas, and getting visuals to sit exactly on its shapes is fiddly, repetitive work. For more on that side of things, see four ways to create Power BI backgrounds and my walkthrough of AI-generated Power BI backgrounds.
3. The loop runs without me
Write, look, judge, fix. Furthermore, the agent repeats that cycle on its own until the page matches the brief, which means I can leave it working and come back to a result rather than a question.
It is not instant, and I would rather set that expectation honestly. On the build I filmed, it spent around six minutes planning before writing anything. Then it came back with sensible questions: how wide should the panel be, which block should be active. I took the recommended answer both times, and after that I did not touch anything.
4. No more copying errors back and forth
I stopped being the messenger. Rather than screenshotting Power BI Desktop and pasting the problem into a chat window, the agent reads its own output directly. Overall, this removed the most tedious part of the workflow.
5. Bookmarks stopped being my job
Bookmarks are the most thankless job in Power BI. One interactive page needs dozens of them, each with the right visuals hidden, the right ones shown, and a name you will still understand in six months.
Now scale that to ten pages. You are suddenly looking at hundreds of bookmarks, and keeping track of them stops being realistic. Accordingly, this is the part I am happiest to hand over — the agent creates them, names them, and thanks to the bridge it checks that each state renders correctly. That is exactly how the pop-up filter panel below was built.
An agent can build the page, but it cannot tell you whether the measure is right or the model is sound. If you want to shore up that side, DataCamp runs structured, hands-on Power BI, DAX and data modelling courses, and new users get a discount on their first subscription.
Explore DataCamp courses →A real example: a gradient pop-up filter panel
Descriptions are cheap, so here is the proof instead. The idea was not mine — I saw a report in the Fabric community gallery with a filter icon that opens a second panel carrying the same gradient, and I wanted to know whether I could recreate it.
So I did the least sophisticated thing possible. I took a screenshot of it, took a second screenshot of my own report, and asked Claude for a few variations in the green theme I already use. That is the whole design brief. You do not need to be a designer here — you mostly need to orchestrate it.
The requirement was specific. The dark gradient had to run continuously from the collapsed icon rail into the expanded panel, with no visible seam. As a result, opening the panel reads as the rail growing rather than a new object appearing. Moreover, every slicer had to line up, and the reset had to actually clear the selection.


Watch the full build
The whole session is on video, including the parts where it got things wrong and corrected itself. In particular, watch how the screenshot step changes the agent’s next move.
The design idea came from Gus Barros in the Fabric Community gallery. Credit where it is due — I rebuilt the idea, I did not invent it.
Power BI Desktop Bridge vs MCP server vs authoring skill
Notably, these three get confused constantly, even though they solve different problems. Below is the split I use in practice.
| Layer | Tool | Reach for it when |
|---|---|---|
| Semantic model | Power BI Modeling MCP server | You need tables, columns, relationships or DAX measures. |
| Report layer | Report authoring skill | You need pages, visuals, slicers, bookmarks or a theme. |
| Live verification | Power BI Desktop Bridge | You need the agent to reload and actually see the render. |
| Design and planning | Report design and planner skills | You are starting from a blank page rather than an edit request. |
In other words, the skill knows what to write, the MCP server owns the data model, and the bridge is what confirms the result. For the wider picture, see Power BI vs Fabric and my Claude skills starter kit. Additionally, the PBIR report builder skill shows the home-grown version I used before Microsoft shipped theirs.
Limits of the Power BI Desktop Bridge
Now, the honest part. The Power BI Desktop Bridge is genuinely useful, but it is early software with real edges.
- It is in preview. Specifically, Microsoft states that features, behaviour and the API surface may change before general availability.
- One operation at a time. For example, send a second request while another runs and you get an error rather than a queue.
- Local only. In effect, there is no remote access, so this does not help with the Power BI Service.
- Unsaved changes are invisible. The agent reads PBIR from disk. Consequently, anything you have not saved gets lost.
- Errors are not always surfaced. The CLI can report success even when Power BI rejected the file, which is tracked as an open issue titled “Power BI Desktop Bridge CLI doesn’t expose errors”. Consequently, always look at the screenshot rather than trusting the exit status.
- Some visuals are off-limits. In particular, Microsoft recommends avoiding Q&A, Bing maps and filled maps, since they are being deprecated.
- Screenshots are not judgement. The agent can see that a chart rendered. However, it cannot tell you the chart was the wrong choice.
There is a softer limit that no documentation will tell you about, so I will. The first render is rarely the final one. On my own build a couple of elements needed rework — the back option did not really show, and one or two things simply did not make sense on screen. You still need a few rounds of iteration, and you still need to be the person who decides when it is finished.
You can argue about whether the result is beautiful. That argument is still yours to have — the agent will not have it for you.
Is the Power BI Desktop Bridge worth setting up?
Overall, yes. Ten minutes of setup buys back hours of bookmark and alignment work, and it moved AI in Power BI from something I had tried and put down into something I now reach for by default. That is a bigger shift than it sounds, because the thing that changed was not the model — it was being able to check its own work.
And this is genuinely only the surface. Once an agent can edit a report and verify the result, entire automation pipelines open up. Themes applied across a workspace, bookmarks generated at scale, a design brief turned straight into a built page. I have used a fraction of it so far.
Set it up if you already work in PBIP, you are comfortable in a terminal, and your pain is repetitive report mechanics. Wait if your reports live as .pbix files in a shared drive, or if you need something stable enough to hand to a whole team today. Preview software and team rollouts do not mix well.
Frequently asked questions
Can Claude actually build a Power BI report on its own?
Yes, within limits. With the report authoring skill and the Power BI Desktop Bridge, Claude can create pages, visuals, slicers, bookmarks and themes, then verify the render and correct itself. However, it still needs a semantic model to bind to and a human to judge whether the result answers the business question.
Does the Power BI Desktop Bridge work with a .pbix file?
No. The report authoring skill works only with PBIP projects, because a .pbix is a single compressed container that an agent cannot edit file by file. Use File > Save as > Power BI project to convert, then point the agent at the folder.
Do I need GitHub Copilot, or does this work with Claude Code?
Both work. Microsoft optimises Skills for Fabric for GitHub Copilot CLI, and it ships compatibility shims for Claude Code, VS Code Copilot, Cursor, Codex and Windsurf. I use Claude Code, and the install scripts configure the right files automatically.
More questions about this
Is the Power BI Desktop Bridge safe — can it see my data?
The bridge itself is local only. It runs inside the Power BI Desktop process and communicates through a named pipe, with no remote access supported. Nevertheless, a screenshot of a report page contains whatever values are on screen, so treat those images with the same care as the report.
What is the difference between the Desktop Bridge and the Power BI MCP server?
The MCP server works on the semantic model — schemas, DAX and measures. In contrast, the Desktop Bridge drives the Power BI Desktop application itself, reloading files and capturing screenshots. Most real workflows use both.
What can AI still not do in Power BI?
It cannot gather requirements, choose the right chart for a decision, or tell you that a measure is technically valid but conceptually wrong. Above all, it cannot decide what good looks like. In my experience, that is still the part clients actually pay for.
Where to go next
If you want to build something with this, start with the pop-up filter panel walkthrough — it is the same report shown above, step by step. For the tooling itself, the report authoring skill guide covers what ships in the repository and how to extend it with your own examples.
Last updated 13 August 2026. Written by Lukas Reese, a freelance Power BI consultant working with clients in Germany and the US on data modelling, DAX and dashboard design.