
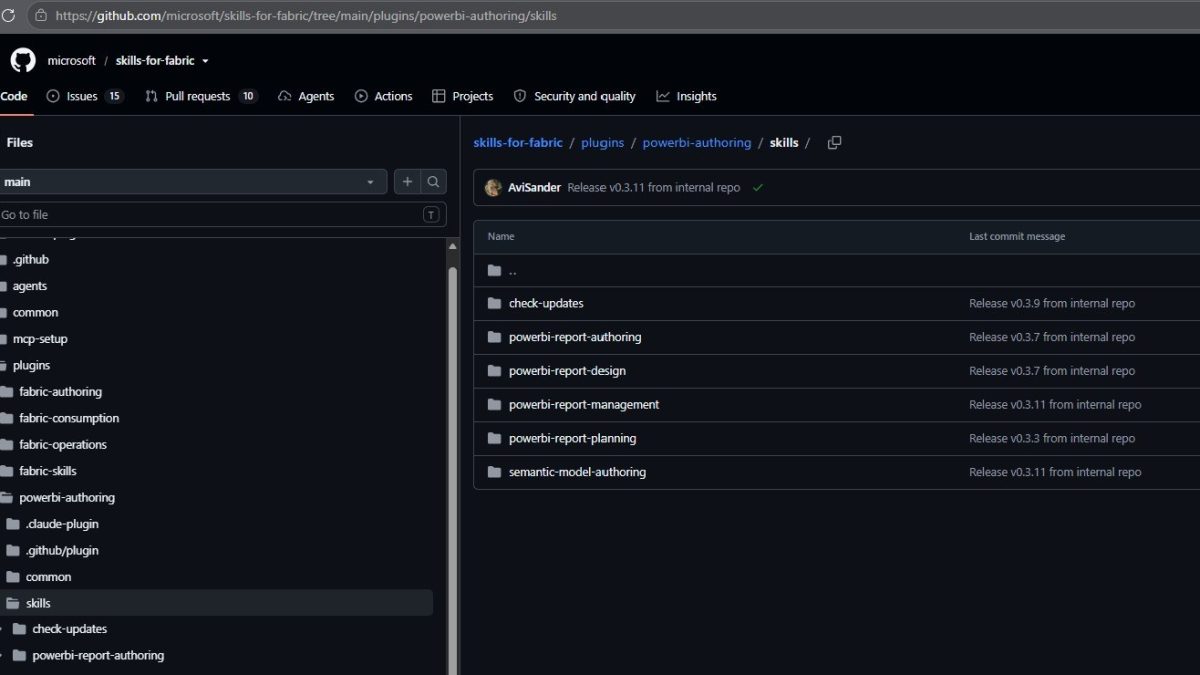
The Power BI report authoring skill is a first-party Microsoft agent skill that lets an AI assistant create, edit and validate Power BI reports in the PBIR format. It ships free in the Skills for Fabric repository on GitHub, and it is the piece that turns “AI can write JSON” into “AI can build a report”.
I have been working with this skill quite a lot, so this is the reference post for the whole toolchain. Specifically, it covers what is in the repository, how to install it, what the skill can and cannot do, and how I make it better by feeding it my own examples. If you want the story rather than the reference, start with the Power BI Desktop Bridge instead.
See this skill build a real report page
My free guide shows how I extend the report authoring skill with my own references and build a finished page: 25 pages, 7 prompts, and the PBIP file.
- The Power BI report authoring skill is published by Microsoft, free, and MIT licensed.
- It lives in the
powerbi-authoringplugin inside the Skills for Fabric marketplace. - Specifically, it owns the report layer only. The semantic model belongs to the Power BI MCP server.
- Furthermore, it works with PBIP projects only. A .pbix will not work.
- The Desktop Bridge CLI ships alongside it, which is what lets the agent verify its work.
- The skill knows the basics, not your basics. Feed it your own PBIR examples and it gets measurably better.
What is the Power BI report authoring skill?
The Power BI report authoring skill is a folder of instructions, schemas and scripts that an AI coding agent loads on demand so it knows how to write valid PBIR files. In other words, it is documentation written for a machine rather than a person.
When I open it in my own skills folder it is simply a long markdown file describing how a Power BI project file works, with references for the awkward parts — bookmark panels, conditional formatting expressions, and so on.
Notably, that framing matters. A general-purpose model knows what a bar chart is, but it does not know that a PBIR visual container needs a specific schema version, or that displayOption is one-based rather than zero-based. Consequently, without the skill, an agent produces JSON that looks plausible and does not open.
A skill is not a smarter model. It is a model that has finally read the manual.
Specifically, Microsoft distributes it inside the Skills for Fabric repository, its first-party catalogue of Microsoft Fabric skills. The project is MIT licensed, so you can read every line and fork it. Microsoft also documents the wider picture in its Power BI Agentic overview.
What is inside the Skills for Fabric repository
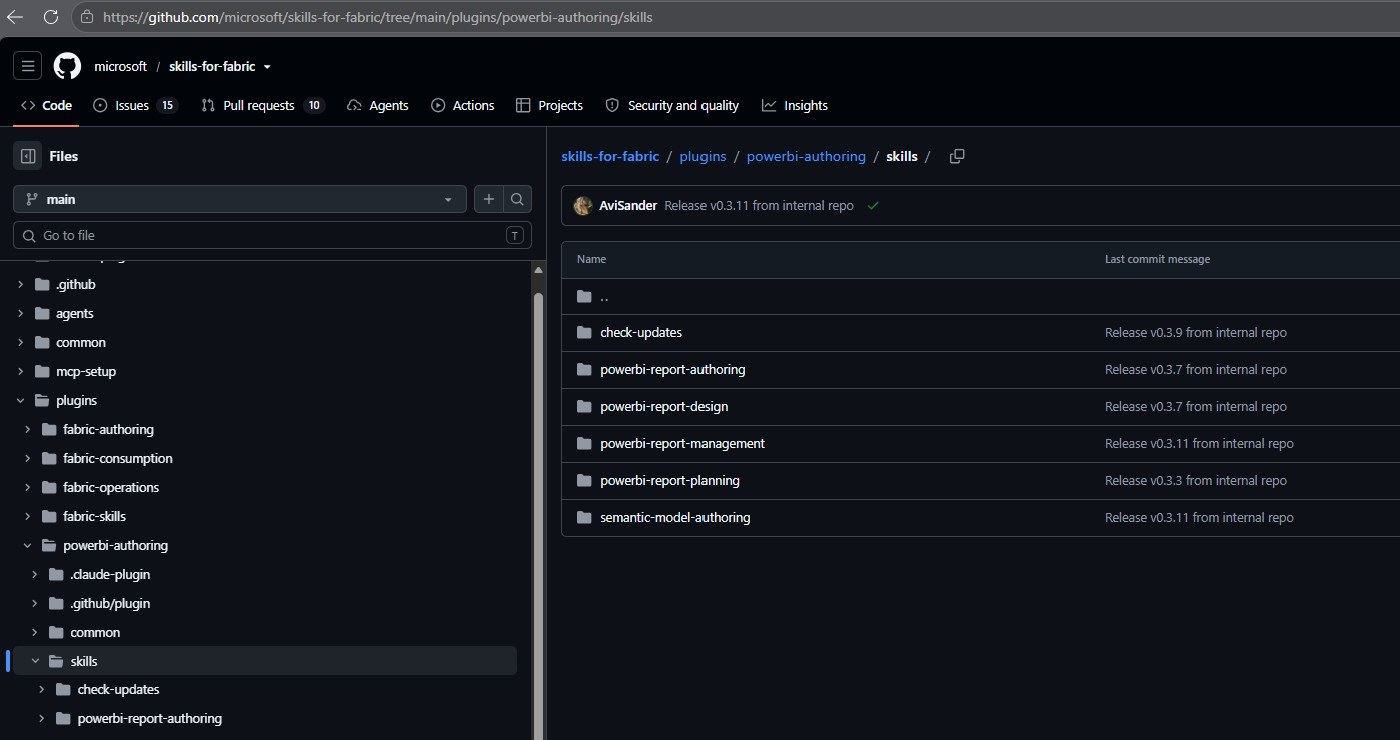
The repository is broader than Power BI. Specifically, it bundles skills into five plugins, and only one of them concerns report developers.
| Plugin | Covers |
|---|---|
| powerbi-authoring | Semantic models, reports and PBIP workflows. This is the one you want. |
| fabric-skills | The complete Fabric bundle — authoring, consumption, operations, migration, architecture |
| fabric-authoring | Creating items via APIs, CLI automation, notebooks, T-SQL and KQL |
| fabric-consumption | Read-only exploration across warehouses, lakehouses and semantic models |
| fabric-operations | Performance and health diagnostics, including warehouse query insights |
Alongside the plugins the repository ships agent configuration files — CLAUDE.md, AGENTS.md, .cursorrules, .windsurfrules and GEMINI.md. As a result, several agents pick the skills up automatically once the repository is cloned.
How to install the Power BI report authoring skill
Overall, installation is two commands, and the same marketplace workflow covers both GitHub Copilot CLI and Claude Code. I run it through Claude, but the steps do not change.
Prerequisites
- Node.js 18 or later — specifically required for the Power BI Modeling MCP server and both CLIs.
- An agent. Notably, Microsoft optimises for GitHub Copilot CLI, with compatibility shims for Claude Code, VS Code Copilot, Cursor, Codex/Jules and Windsurf.
- A PBIP project. Not a .pbix.
- Power BI Desktop, if you want live verification through the bridge.
Install the plugin
copilot plugin marketplace add microsoft/skills-for-fabric
copilot plugin install powerbi-authoring@fabric-collection
Additionally, the plugin registers the Power BI Modeling MCP server for you. Otherwise you would be wiring up the MCP server and adding each skill by hand, which is a considerably longer afternoon.
Confirm the skills loaded
Then start your agent and list the available skills. For example, in Copilot CLI that is simply /skills. You should see powerbi-report-authoring and semantic-model-authoring in the list.
Add the command line tools
npm install -g @microsoft/powerbi-report-authoring-cli
npm install -g @microsoft/powerbi-desktop-bridge-cli
In effect, these give you powerbi-report-author for validation and powerbi-desktop for driving Power BI Desktop. Both are worth having even if you only ever use the agent, and the bridge CLI package on npm lists every command.
Power BI report authoring skill vs the other four
Five skills ship in the plugin, and they are easy to confuse. Consequently, here is the routing I use in practice.
| Skill | Start here when |
|---|---|
| powerbi-report-authoring | You have a concrete edit: “add a card showing Total Sales”. |
| powerbi-report-design | You have a blank slate: “design a sales dashboard”. It produces a brief, then hands off. |
| powerbi-report-planning | You need the full pipeline: requirements, approval, then build. |
| powerbi-report-management | You need to publish or manage reports in a Fabric workspace. |
| semantic-model-authoring | You need tables, relationships, DAX measures or a refresh. |
In practice the design skill produces a brief and the Power BI report authoring skill executes it. That split is deliberate: design decisions get made once and written down, then the mechanics run deterministically against them.
What the Power BI report authoring skill can do
Specifically, the skill owns the report layer, and within that boundary it is genuinely capable. Here is what I have used it for on real work.
Here is one of those jobs end to end — IBCS-style variance charts built from native visuals, no paid add-ons, written by the skill and checked through the Desktop Bridge.
- Above all, create a report from an existing semantic model — pages, cards, bar charts, tables, all bound to real fields.
- Add a page with a clustered column chart, KPI cards and a date slicer.
- Re-theme an existing report, specifically including
dataColors,textClassesandvisualStyles. - Modernise legacy visuals — convert old
cardand matrix visuals tocardVisualandpivotTable, reapplying selector-based formatting. - Diagnose a broken visual that renders as an error icon or an empty frame, and fix the underlying query state or role bindings.
- Build bookmarks at volume — the tedious work behind any pop up filter panel or drillthrough pattern.
- Finally, validate before you open Desktop using
validate-report, which catches structural problems early.
Above all, that last one deserves a mention on its own. Validation is the difference between an agent that guesses and an agent that checks — and it costs nothing to run.
What the Power BI report authoring skill cannot do
Now, the boundaries — taken from Microsoft’s own considerations plus a few I have hit myself.
- It only works with PBIP files. Indeed, Microsoft states this plainly. Convert with File > Save as > Power BI project, and read PBIX vs PBIR vs PBIP if the distinction is unfamiliar.
- It does not touch the semantic model. In other words, tables, columns, measures and DAX belong to the Power BI Modeling MCP server or the TMDL layer.
- Unsaved Desktop changes are invisible. Consequently, the PBIR file on disk is the source of truth, so save before you let the agent iterate.
- Some visuals are off-limits. In particular, Microsoft advises against Q&A, Bing maps and filled maps because they are being deprecated.
- It is preview software. Therefore, commit a baseline to source control first. The bridge CLI can also report success when Power BI actually rejected the file, which is tracked as an open issue on the repository.
- It has no taste. In effect, it executes a design brief. It does not tell you the brief was wrong.
The skill knows the schema. It does not know your business. That gap is still the job.
Everything above assumes you can tell a good model from a bad one and a right measure from a plausible one. DataCamp runs hands-on Power BI, DAX and data modelling courses, and new users get a discount on their first subscription.
Explore DataCamp courses →The Desktop Bridge ships with the Power BI report authoring skill
Notably, this is the part people miss when they first read the repository, and it is the single most important thing in it.
In effect, the Power BI report authoring skill can write a perfect PBIR file and still have no idea whether the page renders correctly. The Power BI Desktop Bridge closes that gap: the agent reloads the file in Power BI Desktop, captures a PNG of the page, looks at it, and fixes what is wrong. Microsoft documents the feature in What is the Power BI Desktop Bridge.
Consequently, the end-to-end loop looks like this:
- First of all, the Modeling MCP server makes sure the semantic model has what the report needs.
- The Power BI report authoring skill edits the PBIR files.
validate-reportcatches structural problems.- Then the Desktop Bridge reloads Desktop and captures screenshots.
- A review pass judges the render, and the loop repeats until both checks pass.
Without step four the whole thing is writing blind. That is exactly why I put agentic Power BI down the first time I tried it, long before any of this shipped — the output was fine, but I had no way to let the agent check itself, so every correction came back through me.
Teach the skill: how I make it smarter over time
Finally, here is the part that made the biggest practical difference for me, and it is barely documented anywhere.
The skill knows the basics. However, it does not know your basics. Out of the box it understands the PBIR schema, standard visuals and the common formatting paths. Nevertheless, it has never seen the reports you admire, the patterns you reuse, or the house style you have spent years settling on. That gap is not a flaw — it is simply where your own work has to go in.
The skill knows the basics. It does not know your basics — and the more examples you give it, the smarter it gets.
The loop: find a report you like, then feed it in
This is the workflow I use, and it is deliberately unglamorous.
- Find a report you actually like. For example, a community submission, a competition entry, something a colleague built, or one of your own pages that came out well.
- Save it as a Power BI project. File > Save as > PBIP. Now every page and every visual is readable JSON on disk instead of a sealed binary.
- Pull out the piece you want. Then open the page, or the single visual container you care about, and copy its JSON.
- Hand it to Claude and add it to the skill. Drop that JSON into the report authoring skill as a reference example, with a short note describing what it is and when to use it.
- Next time, it loads. Consequently, the agent reads the example and reproduces the pattern instead of approximating it.
Do that a handful of times and the skill stops being generic Microsoft documentation. Instead, it becomes a record of how you build reports. Several of the references in mine are ones I wrote myself for exactly that reason.
Two things it could not do until I taught it
Rather than keep this abstract, here are the two gaps I hit first. Both are real, and I fixed both the same way.
KPI cards with reference values. Download the skill from GitHub and ask for a card showing the current value, a reference value underneath, and a detail value with conditional formatting picking out the deviation. It cannot do it. Specifically, there is no example of that shape in the skill, so it has nothing to copy. I built one by hand, gave it the JSON, and now it produces that card whenever I ask.
An IBCS visual built from a native bar chart. This one is a bigger ask. I built the visual using nothing but the native bar chart, and it only works because roughly fifteen measures sit behind it, each doing a specific job in the variance layout. Consequently, no amount of schema knowledge gets an agent there. The structure stays invisible unless somebody shows it the finished thing. Once my example was in the skill, it could rebuild the pattern.
If a visual needs fifteen measures behind it to work, the agent cannot infer that from the schema. You have to show it one that already works.
What is worth adding
- Above all, visual patterns you rebuild often, exported straight from a working report.
- Similarly, your theme JSON, so colours and text classes are never guessed.
- Layout rules — canvas size, grid, gutters, standard card dimensions.
- Known-bad patterns, with a short note on why they fail.
A prompt describes what you want. In contrast, an example shows the exact property names, the exact nesting and the exact values that produce it. As a result, the agent stops approximating and starts copying something already proven to open in Desktop.
Honestly, there is enough in this one idea for a post of its own, and I intend to write it. For now the short version is worth acting on. Every time I find a pattern I like, I spend ten minutes putting it into the skill — and it compounds.
I built a home-grown version of this before Microsoft shipped theirs, which is documented in the PBIR report builder skill. If you want to write your own skills from scratch, the Claude skills starter kit covers the structure. Furthermore, the code-first shift and Power BI vs Fabric give the wider context for why Microsoft is shipping agent skills at all.
Frequently asked questions
Is the Power BI report authoring skill free?
Yes. It ships in Microsoft’s Skills for Fabric repository under the MIT licence, so you can read, fork and modify it. You still need an AI agent of your own, and the CLIs it uses are free npm packages.
Does the report authoring skill work with Claude Code?
Yes. Microsoft optimises Skills for Fabric for GitHub Copilot CLI and ships compatibility files for Claude Code, VS Code Copilot, Cursor, Codex/Jules and Windsurf. The repository includes a CLAUDE.md that Claude Code picks up automatically.
Can the skill edit a .pbix file?
No. Microsoft states that the skill works only with PBIP files. A .pbix is a single compressed container, so an agent cannot edit one visual without rewriting everything. Use File then Save as then Power BI project to convert.
More questions about this
What is the difference between the report authoring skill and the report design skill?
The design skill decides what the report should look like and produces a structured brief — archetype, layout, chart selection, colour map. The authoring skill takes that brief and writes the PBIR files. Start with design for a blank slate, and with authoring for a specific edit.
Do I need the Power BI Desktop Bridge as well?
Not strictly, but you want it. Without the bridge the agent writes files it cannot see rendered, so you become the feedback loop. With it, the agent reloads Desktop, screenshots the page and corrects itself.
Can I add my own examples to the skill?
Yes, and it is the highest-leverage thing you can do with it. Find a report you like, save it as a PBIP, copy the JSON of the visual or page you want, and add it to the skill as a reference example. The agent then reproduces that pattern instead of approximating it. Two things I had to teach mine: KPI cards with reference values, and an IBCS visual that needs about fifteen measures behind it.
Where to go next
Install the plugin, then read how the Power BI Desktop Bridge works so the agent can check its own output. After that, build a pop up filter panel as a first real test, and use an AI-generated background SVG to give it something to align to.
Last updated 20 August 2026. Written by Lukas Reese, a freelance Power BI consultant working with clients in Germany and the US on data modelling, DAX and dashboard design.