

Power BI Report CLI (powerbi-report-cli) is Microsoft’s new single skill for building Power BI reports with an AI agent such as Claude Code or GitHub Copilot. In skills-for-fabric release 0.3.17, published on 17 September 2026, Microsoft merged its four report skills, planning, design, authoring and management, into this one skill. As a result, you no longer pick a skill for each step: you ask for the report, and the skill picks the mode.
If you used the Power BI report authoring skill before, this is the same skill under a new name, with the other three built in. To see what changed, I built a four-page sales report with it from one plain CSV file. In this post, I show what each mode does, what my first result looked like and, above all, how I teach the skill my own style.
Get the free guide + PBIP file
25 pages, 7 prompts you can copy, and the Power BI project of the example report. Page 11 shows how to add your own reference files to Power BI Report CLI.
How I Build Power BI Reports with AI
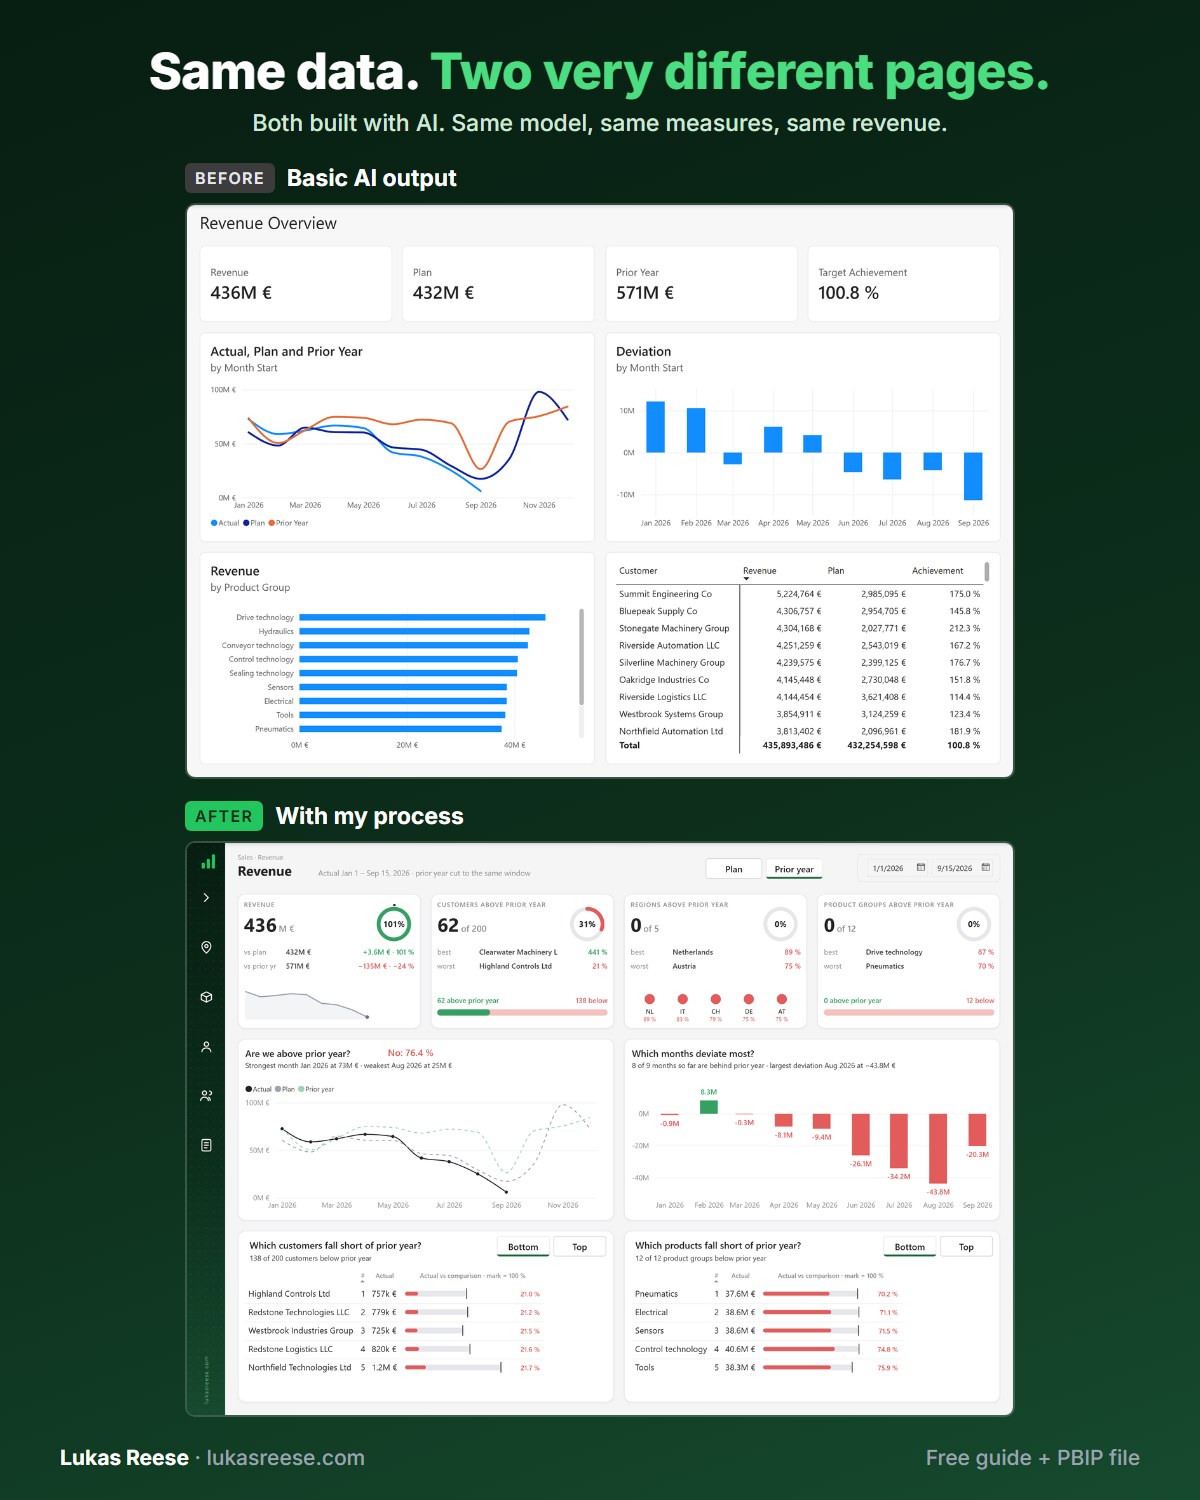
Same data, two very different pages. Both built with AI. This is the process behind the second one.
What you get:
- The 25-page guide: my full process, tool stack and 7 prompts you can copy
- The PBIP file with the same revenue page twice: the basic AI output and the finished page
- Step-by-step explanation, inspiration and real output.
Important: confirm your email
- After you sign up, you get a confirmation email. Click the button in it, then the guide and PBIP file are on their way.
Key Takeaways
- One skill instead of four: Power BI Report CLI replaced the planning, design, authoring and management skills in skills-for-fabric 0.3.17.
- Same skill, new name: the report authoring skill is now the authoring mode, and your old report prompts keep working.
- Four modes, one order: it plans, waits for your approval, designs on a grid, builds and checks the report, and can publish it to Fabric.
- The default is a start: my first result was okay, but it looked like everyone’s report.
- Your references make it yours: short reference files with a picture and the exact JSON teach the skill your style.
What is Power BI Report CLI?
Power BI Report CLI: a single agent skill in Microsoft’s skills-for-fabric repository that plans, designs, writes, validates, publishes and manages Power BI reports in the PBIR format. It sends each request to one of four modes and replaces four earlier report skills.
The name sounds like a new command-line tool. In fact, it is a skill: a folder with a SKILL.md file and reference files that the agent loads for any report request. The “CLI” refers to the command-line tools it drives, for example the powerbi-report-author CLI for validation and az rest for Fabric. Moreover, it ships in the powerbi-authoring plugin, next to semantic-model-authoring, which handles the model and DAX side.

You don’t pick a skill anymore. You ask for the report you want, and Power BI Report CLI picks the mode.
What happened to the Power BI report authoring skill?
In short, it was renamed and merged. Specifically, the 0.3.17 changelog lists powerbi-report-authoring, powerbi-report-design, powerbi-report-management and powerbi-report-planning as removed, replaced by the matching modes of powerbi-report-cli. Microsoft itself calls it a rename as well as a merge.
| Old skill | Mode in Power BI Report CLI | What it does |
|---|---|---|
| powerbi-report-planning | Planning | First, it asks questions, reads the model, plans the pages and waits for your approval. |
| powerbi-report-design | Design | Then it places visuals on a grid, picks page types, applies chart rules and writes a design brief. |
| powerbi-report-authoring | Authoring | Next, it writes the PBIR files, validates them, reloads Power BI Desktop and takes screenshots. |
| powerbi-report-management | Management | Finally, it publishes, downloads, updates and rebinds reports in a Fabric workspace. |
Consequently, two things matter if you used the old skills. First, your existing report prompts keep working, according to the changelog. However, if you pinned one of the four old names in a script or an agent config, switch it to powerbi-report-cli. Also, don’t let the docs confuse you: as of 9 October 2026, Microsoft’s Power BI Agentic overview still lists the four old skills.
The four modes of Power BI Report CLI, on one real build
To see the merged skill at work, I gave it one CSV file of invoice lines and asked for a sales report. Therefore, everything below comes from that single test build: four pages, from the first question to the first result.
Planning: it asks before it builds
First, the planning mode asks questions. Who is the report for? Which shape should it have? How should it feel? I answered that management needs the high level, but my sales manager needs to go down to a single order.
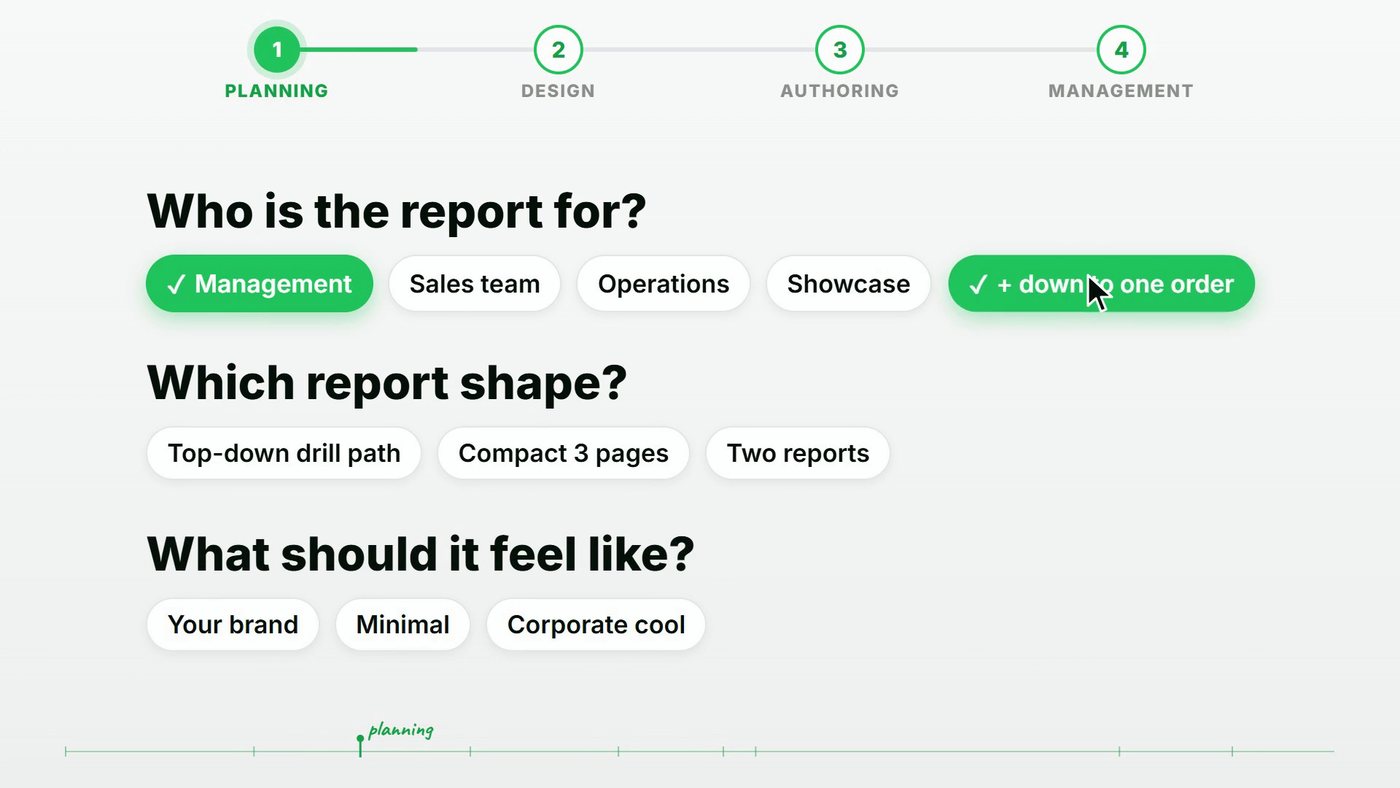
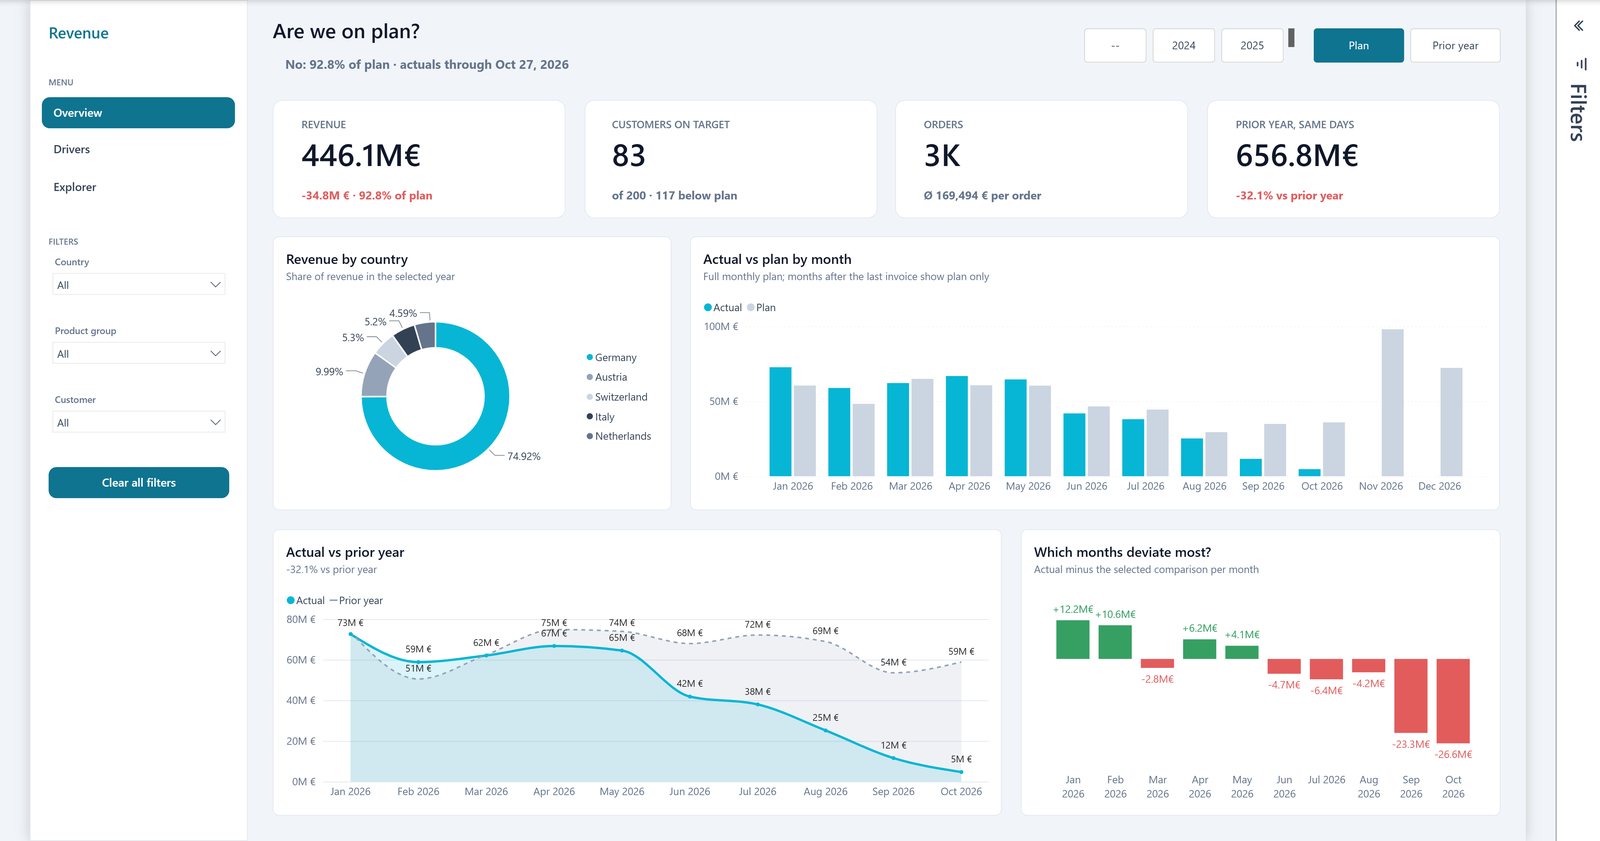
From my answers, it planned four pages, and each page answers one question. Are we on plan? Where does the gap come from? Which managers and orders move revenue? And what is in this one order?

Then it stops. In fact, its rule is to “never build or publish until the user explicitly approves the locked spec.” Even “build it” in your first message does not count as approval. In my view, this gate is the most useful part of planning, because a wrong plan is cheap to fix and a wrong report is not.

Design: a grid, a page type and chart rules
Next, the design mode places every visual on a 12 by 12 grid. It also picks a page type, for example an executive summary for a quick Monday check or an analytical canvas for someone who wants to explore. Furthermore, it follows chart best practices: sorted bars, data labels instead of an axis, no extra lines.
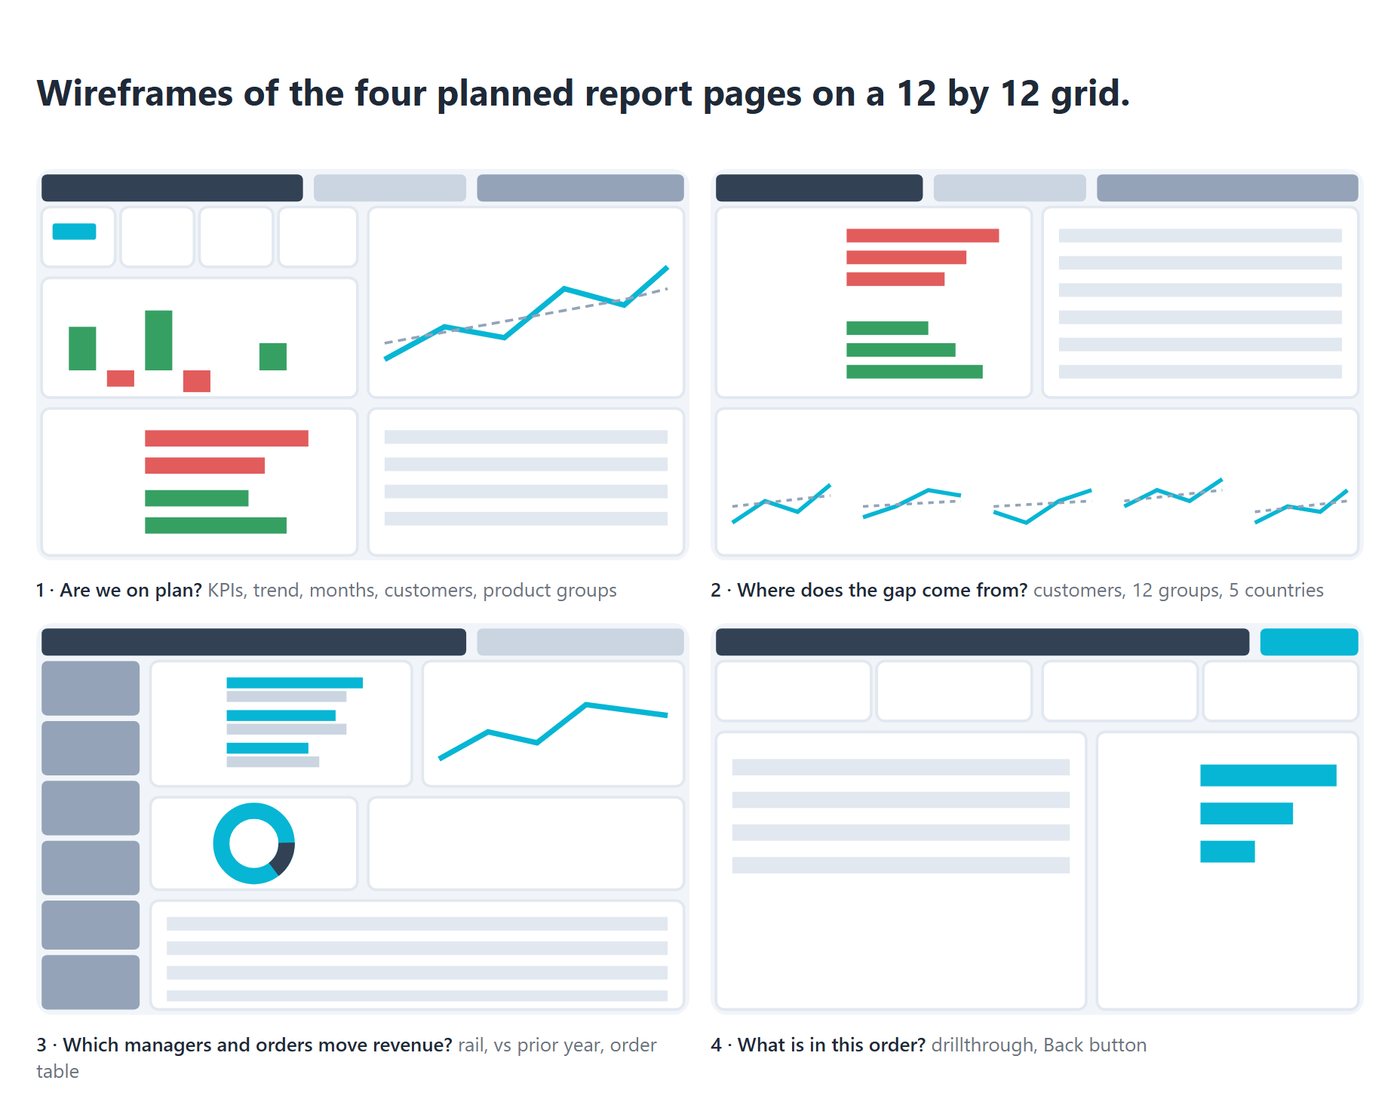
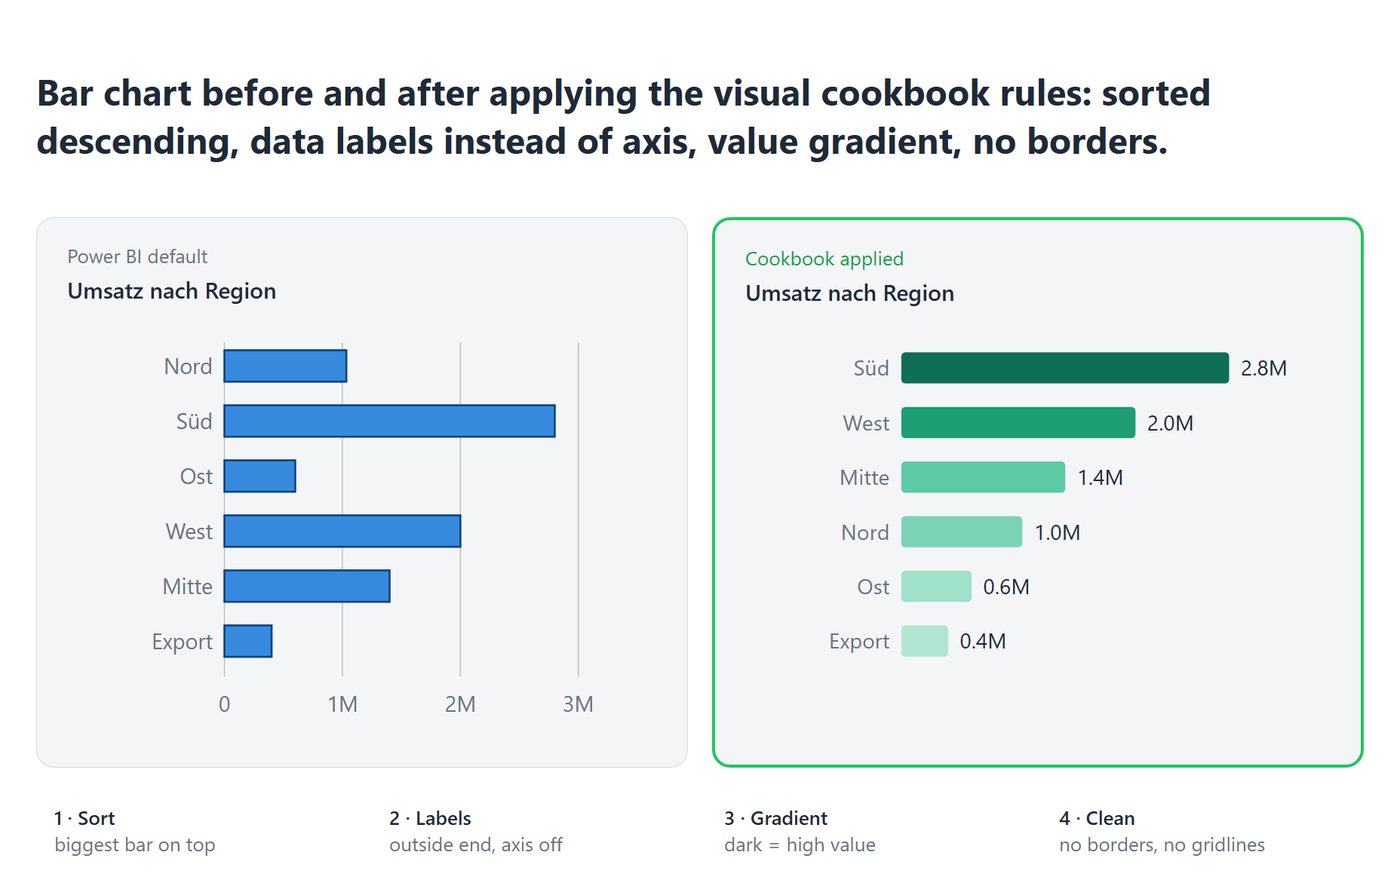
Finally, the design mode writes a visual spec: every visual, with every field and filter, before anything gets built. As a result, a missing field shows up on paper instead of in Power BI Desktop. My Power BI report structure post explains why one question per page works so well.
Authoring: it writes, validates and looks at its own work
Then the authoring mode writes the PBIR report files. It checks them with the powerbi-report-author CLI, reloads Power BI Desktop through the Power BI Desktop Bridge and takes screenshots to review its own work. In other words, it does not stop at “the JSON is valid”; it actually looks at the page. If PBIR is new to you, start with what PBIR is.
Management: publish and rebind in Fabric
Finally, the management mode publishes the report to a Microsoft Fabric workspace, downloads or updates report definitions, and rebinds a report to your semantic model. For this, it calls the Fabric REST API through az rest. To be clear, I did not publish this test build, because it was a local PBIP project. So this is the one mode I describe from the skill’s documentation, not from my build.
When to use Power BI Report CLI: 4 scenarios
You don’t have to run all four modes every time. In fact, the skill picks the narrowest mode that covers your request, so what you ask for decides how much of the process runs. Here are the four situations I use Power BI Report CLI for.
| Scenario | Modes that run | Start with a prompt like |
|---|---|---|
| New report from scratch | Planning, design, authoring, then management if you publish | “Build a sales report from this semantic model for my management team.” |
| Redesign an existing report | Design, then authoring | “Redesign the Overview page in my brand. Keep all fields and measures.” |
| Small edit on an existing page | Authoring only | “Add a card with revenue vs plan to the top row of the Overview page.” |
| Publish or reconnect a report | Management only | “Publish this PBIP to the Sales workspace and rebind it to the Sales model.” |
1. Greenfield: a new report from scratch
This is the full process from this post. First, planning asks who the report is for and plans the pages, then it waits for your approval. After that, design lays out every page, authoring builds it, and management publishes it if you want. Use it when no report exists yet, or when the old one is so far off that a rebuild is faster than a fix.
My tip: answer the planning questions with the decision the report supports, not with a list of KPIs. For example, “my sales manager needs to see which customers fall short of plan” gives a better page plan than “show revenue, margin and orders”.
2. Redesign: the report works, but it does not look right
Often the numbers are fine, but the page looks dated or does not follow your brand. In that case, skip planning. The design mode reviews the existing page, picks a page type, applies the chart rules and writes a design brief, and then the authoring mode applies it. Above all, say “keep all fields and measures”, so the redesign changes the look and not the logic.
This is also where your own reference files pay off most, because the design follows your patterns instead of the defaults. If you want to restructure the pages first, read my post on Power BI report structure.
3. Small edit: authoring only
For a concrete change, such as a new card, a different sort order, a slicer or a colour rule, you need neither planning nor design. The authoring mode edits the PBIR files, validates them and takes a screenshot through the Desktop Bridge. Name the page and the visual in your prompt, so the agent does not have to guess which one you mean.
In practice, most report work is not a new report. Instead, it is the tenth change to an existing one.
4. Publish, download and rebind: management only
The management mode works with reports in a Fabric workspace: it publishes a local PBIP, downloads a report definition, updates it, or rebinds it to another semantic model. For this, you need the Azure CLI and a login with access to the workspace.
Modes also combine. For example, to change a report that only lives in Fabric, management downloads it, authoring edits it locally, and management updates it again. Similarly, a redesign often ends with a publish.
You don’t run the whole process every time. What you ask for decides which modes run.
Is the first result good?
Honestly, it’s okay. It is a good start: four pages that answer four real questions, KPI cards on top, a trend, a deviation chart and a ranking. However, it is not my style. For example, the cards don’t show targets, the colours don’t follow my rules, and the rankings can’t switch between top and bottom customers.
That is not a flaw of the skill. Rather, the skill simply does not know how I work. Since Microsoft’s default is the same for everyone, the output looks like everyone’s report.
A default skill gives everyone the same report. Your own reference files are what make it yours.
How to make Power BI Report CLI your own
So I teach it. Specifically, I add my own reference files to the skill, and then my brand and my templates.
Reference file: a short Markdown file inside a skill that shows the agent one pattern you use. It says when to use the pattern, gives the exact settings (for Power BI, the exact visual JSON) and shows a picture of the finished result. The agent reads it whenever a task matches.

The reference files I added
| Reference file | What it teaches the skill |
|---|---|
| conditional-colour.md | First, my colour rules, with the exact JSON the skill does not know yet. |
| html-composition.md | Also, how I build HTML and SVG images inside a report, for example KPI cards and target bars. |
| button-slicer.md | In addition, how I format buttons, for example to switch between plan and prior year. |
| ranking-tables.md | Similarly, rankings that switch between the top and the bottom customers. |
| overlay-panels.md | Finally, a side panel that pops out with all the filters, like my pop-up filter panel. |
Each reference is text plus a picture. In my experience, text-only references get messy, whereas the picture shows the agent what “done” looks like. After that, I add my brand and my templates: header, sidebar, rounding and background.
Before and after: same skill, my references
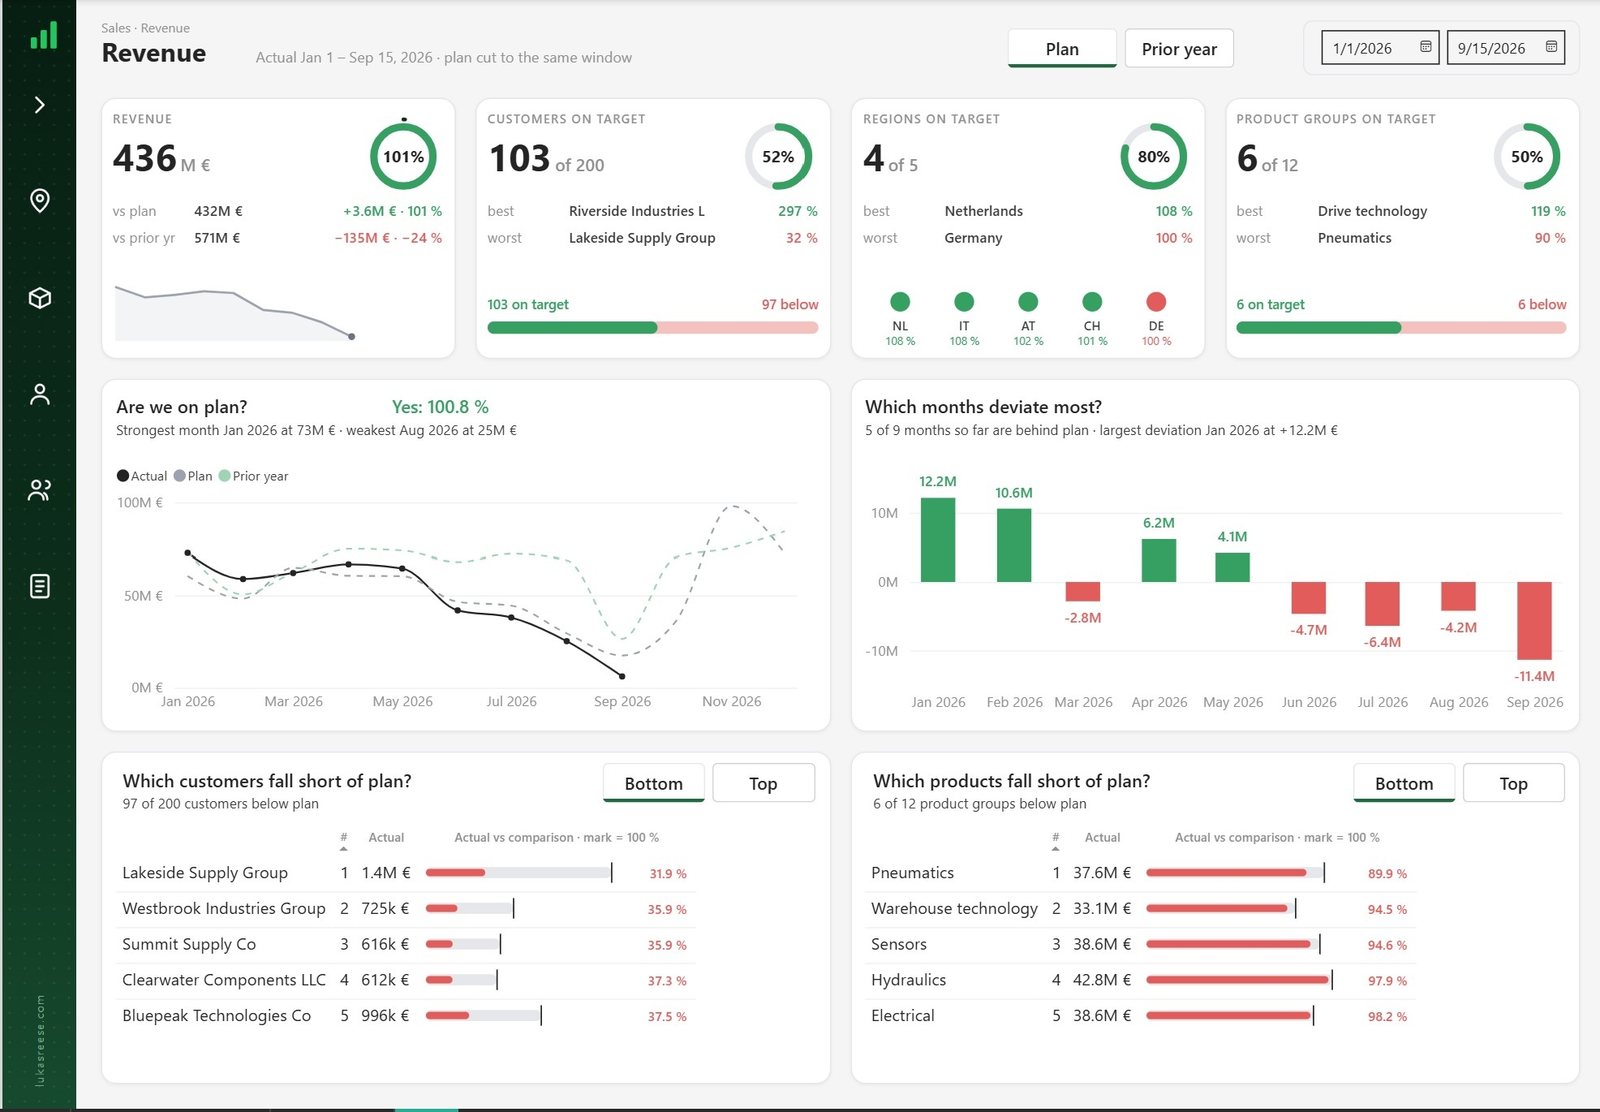
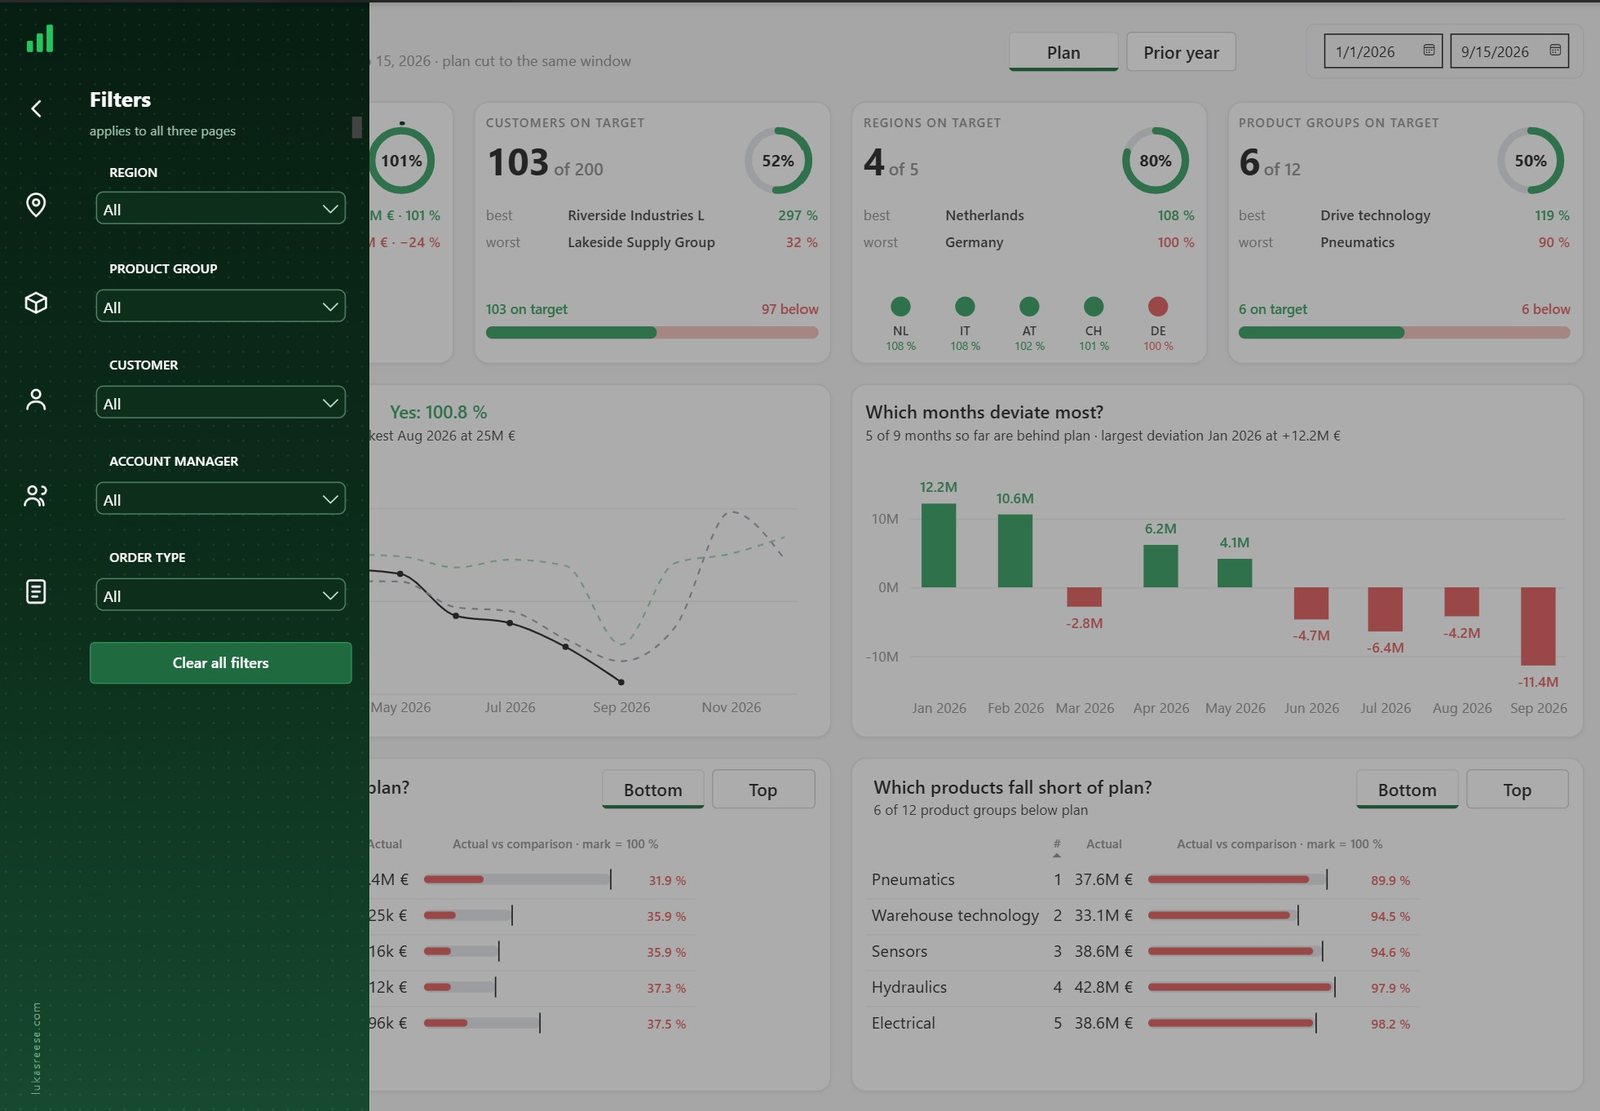
Same skill. My references. That is the whole difference between the two pages.
The prompt I use to add a reference
Please add this visual to my report skill (powerbi-report-cli) as a new reference.
The reference image is attached: ![]() . Take the exact settings from
[path to visual.json] and keep the entry short.
. Take the exact settings from
[path to visual.json] and keep the entry short.This prompt is on page 11 of my free guide, together with six more. Moreover, my older post shows how I first taught the report authoring skill. The full loop from reference to finished page is in my Claude Code Power BI workflow.
An agent copies the patterns you give it, so it pays to know what good looks like. DataCamp offers structured, hands-on courses in Power BI, DAX and data visualization, built for practitioners. In addition, new users get a significant discount on their first subscription.
Explore DataCamp Courses →How to install Power BI Report CLI in Claude Code
Power BI Report CLI is free and open source in Microsoft’s skills-for-fabric repository on GitHub. In Claude Code, add the marketplace and install the Power BI plugin with these two commands:
/plugin marketplace add microsoft/skills-for-fabric
/plugin install powerbi-authoring@fabric-collection
The plugin is called powerbi-authoring, and it brings Power BI Report CLI together with semantic-model-authoring. Alternatively, you can install only this skill with APM: apm install microsoft/skills-for-fabric --skill powerbi-report-cli. In GitHub Copilot CLI, the same install works with the copilot plugin commands from the Agentic overview.
What else you need
- Power BI Desktop with your report saved as a PBIP project. If you are unsure which format you have, read PBIX vs PBIR vs PBIP.
- The Desktop Bridge, so the agent can reload the report and take screenshots. In recent builds it is on by default.
- Node.js 18 or later, because the plugin also registers the Power BI Modeling MCP server.
- Azure CLI with az login, but only for the management mode, which talks to Fabric.

Keep your references safe when the skill updates
One tip from my own setup: keep a list of everything you add to the skill. For instance, I keep a LUKAS-PATCHES.md file in my copy of Power BI Report CLI that lists my extra reference files. Consequently, when Microsoft ships a new version, I update and re-add my references in minutes instead of losing them.
Skills change fast: what I take from this
My post about the report authoring skill went live on 12 August 2026. Barely five weeks later, on 17 September, that skill had a new name and three more skills built in. By early October, the repository was already at release 0.3.19 and the skill at version 1.0.5.
Therefore, I now check the changelog before I build anything big, I keep my own know-how in my own reference files, and I treat the default as a starting point. AI changes fast, and so does Microsoft.
Skills get renamed and merged. So don’t just use the default. Make the skill your own.
If you want to go further, here are five report jobs you can hand to an agent.
FAQ about Power BI Report CLI
My free guide “How I Build Power BI Reports with AI” has 25 pages, 7 prompts you can copy, and the PBIP file of the example report.
Get the free guide →Last updated: 9 October 2026 · Written by Lukas Reese, Power BI consultant. Tested with powerbi-report-cli 1.0.5 in Claude Code.