
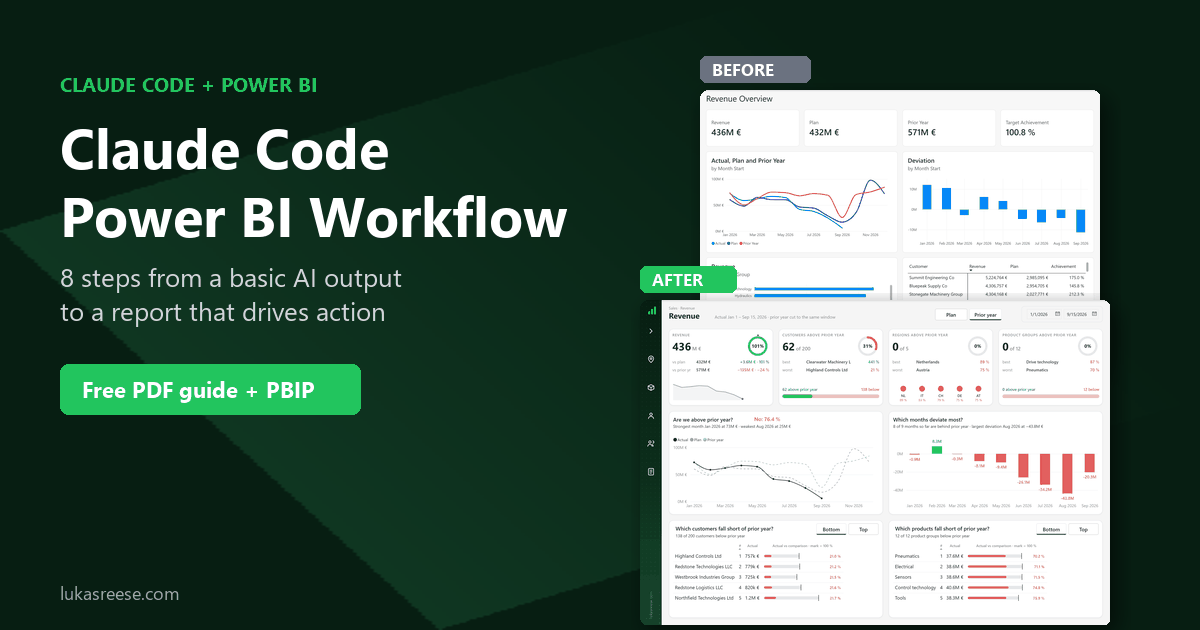
My Claude Code Power BI workflow is not one clever prompt. It is a small system: an AI agent, a skill that holds my report patterns, and a Power BI project saved as text files, run through 8 steps from a reference report to a finished page. Many people asked me on LinkedIn how I build Power BI reports with AI, and every time I tried to answer in two lines, I left out the part that actually makes it work.
So here is the whole framework in one place. First, I show the Claude Code Power BI process on one page, then my setup, then each step with the real page I built with it. In addition, I wrote everything down as a free 25-page guide with 7 copy-paste prompts and the PBIP file of the example report, so you can run the loop yourself.
Get the free guide + PBIP file
25 pages, 7 prompts you can copy, and the Power BI project with both pages from this post. The download link arrives after you confirm your email.
How I Build Power BI Reports with AI
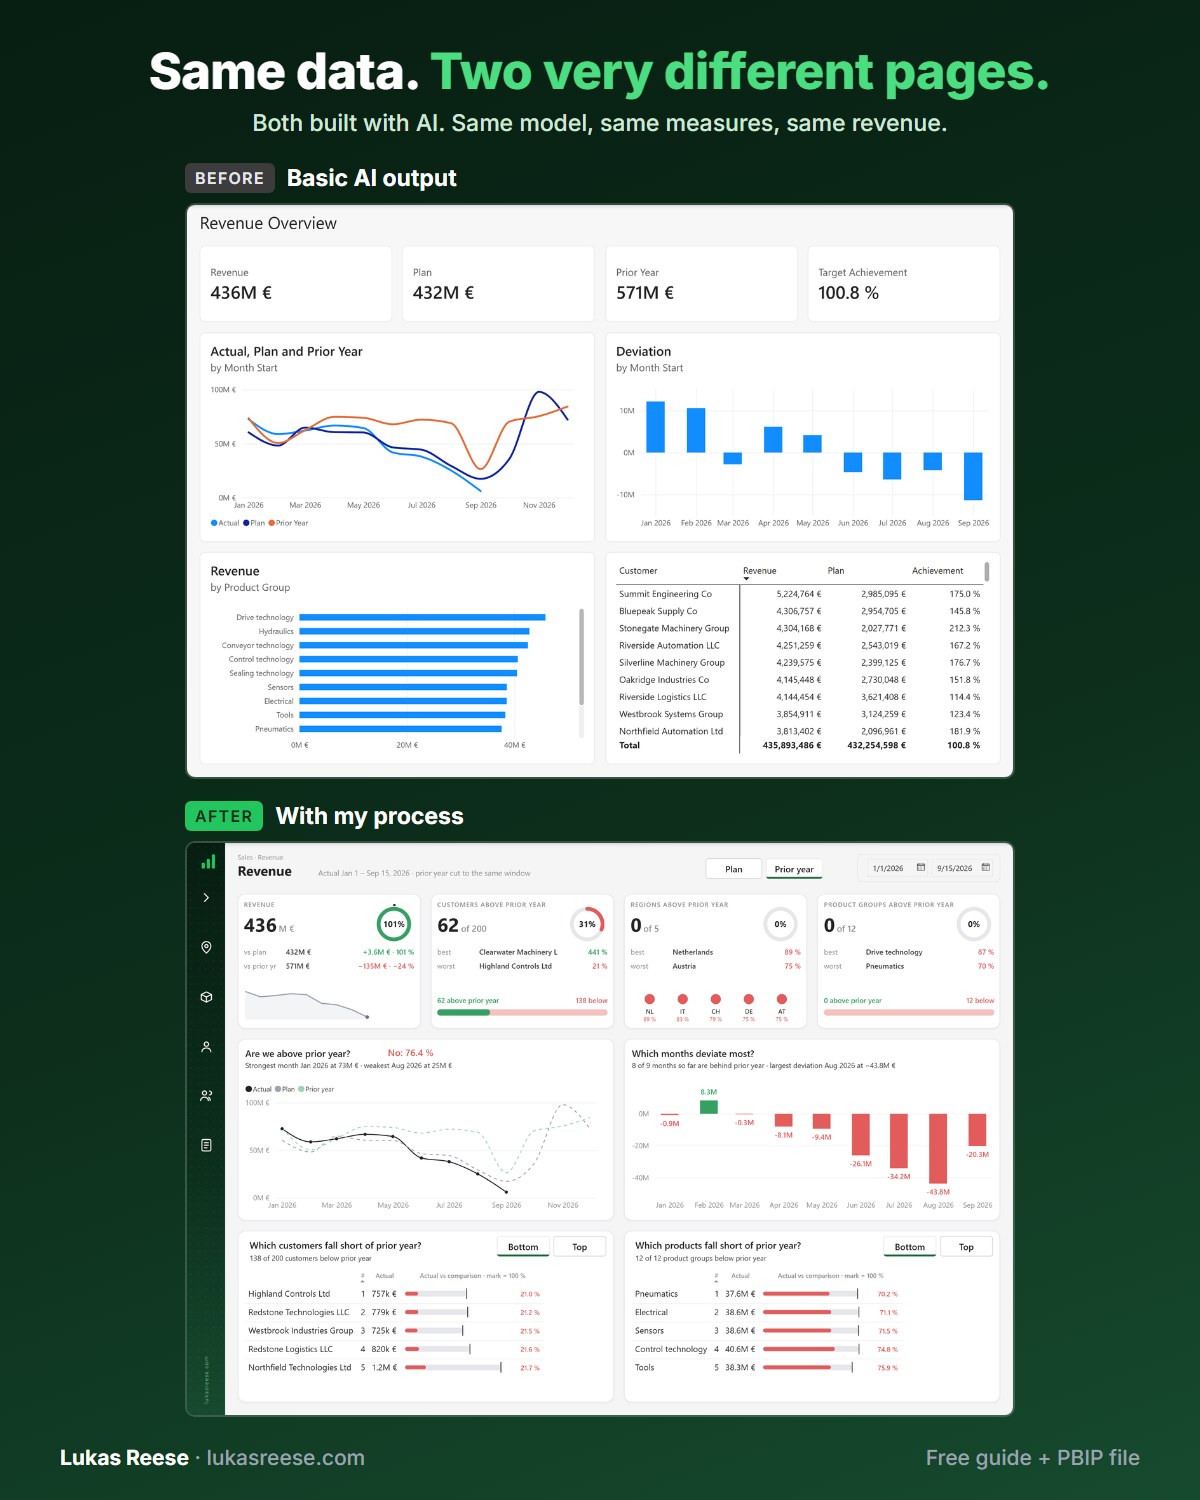
Same data, two very different pages. Both built with AI. This is the process behind the second one.
What you get:
- The 25-page guide: my full process, tool stack and 7 prompts you can copy
- The PBIP file with the same revenue page twice: the basic AI output and the finished page
- The process on one page, to print and keep next to your screen
Key Takeaways
- Three parts: in a Claude Code Power BI setup, the agent is the worker, the skill is its playbook, and PBIP is the material it works on.
- 8 steps in 3 phases: set up once, then the reference loop (steps 1 to 4), then plan, build and design (steps 5 to 8).
- The reference loop is where most of the quality comes from: you teach the skill the visuals you like, with their settings and a picture.
- Plan in HTML first. A mock-up that uses only real fields from your model shows gaps before Claude Code builds anything in Power BI.
- Start with sample data. A PBIP project holds no data rows, yet its metadata can still reveal business logic and names.
Why one prompt is not enough for Claude Code and Power BI
When you ask Claude Code or any other AI for a Power BI “revenue report”, you get a page that works but looks like every other default page. That is not a Claude problem. Claude Code simply knows the Power BI basics, and it does not know your basics: your layout, your colors, the visuals you trust, and the questions your report has to answer.
Plenty of Power BI AI demos show the prompt and skip the system around it. Therefore, remember that the quality of Claude Code in Power BI comes from that system, not from the prompt. In the guide I sum it up in one sentence:
The agent is the worker, the skill is its playbook, and PBIP is the material it works on. Everything else is about making each of the three better.
Three terms behind Power BI AI agents
AI agent: an AI that does not just answer but takes steps. It reads files, runs tools, checks the result and tries again until the task is done. Claude Code, Codex and GitHub Copilot CLI are command-line agents that run in your Power BI project folder.
Skill: a folder of instructions and examples the agent loads when a task matches. Think of it as a playbook. Microsoft publishes Power BI AI skills, and you can add your own references to them.
PBIP: a Power BI project saved as a folder of readable text files instead of one sealed PBIX file. Every Power BI page, visual and measure becomes something Claude Code can read, change and check.
If you want the bigger picture of where this sits, I described the stages from chat help to full agents in the 5 levels of AI in Power BI development. Microsoft also documents the building blocks in its Power BI agentic overview.
The Claude Code Power BI framework on one page
This is the whole process at a glance. Print it and keep it next to your screen, so you do not skip the steps that feel slow.
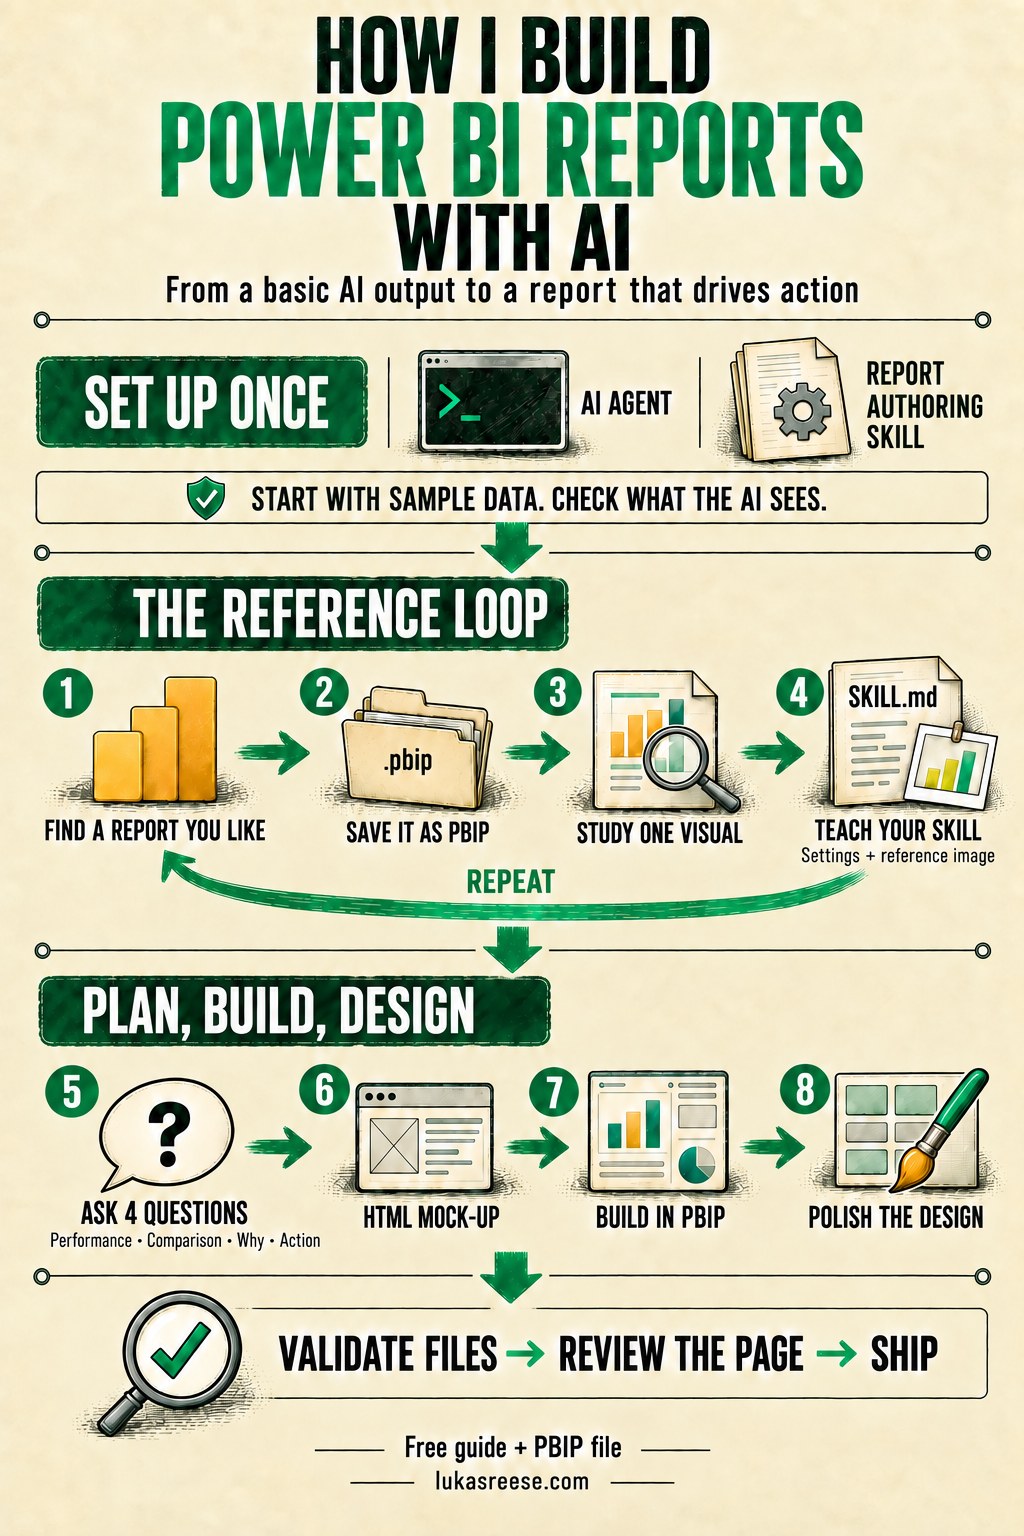
In short, the Claude Code Power BI framework has one setup phase and two working phases:
| Phase | Step | What happens |
|---|---|---|
| Set up once | Agent + skill | First, install Claude Code and the Power BI report authoring skill. Then start with sample data and check what the AI sees. |
| Reference loop | 1. Find a report you like | For example, a challenge entry, a YouTube build or a Dribbble design. |
| Reference loop | 2. Save it as PBIP | As a result, the agent can read how it is built. |
| Reference loop | 3. Study one visual | Next, the agent explains layout, formatting, measures and colors. |
| Reference loop | 4. Teach your skill | Finally, you add the settings plus a reference image. Then repeat. |
Phase two: plan, build, design
| Phase | Step | What happens |
|---|---|---|
| Plan, build, design | 5. Ask 4 questions | First, write down performance, comparison, why and action. |
| Plan, build, design | 6. HTML mock-up | Then the agent draws the page from real fields of your model. |
| Plan, build, design | 7. Build in PBIP | After that, the agent builds the page, reloads Desktop and checks screenshots. |
| Plan, build, design | 8. Polish the design | Finally, the design system and the background do the rest. |
| Ship | Validate, review, ship | In the end, a person checks the page before it goes out. |
My Claude Code Power BI tool stack
People often ask which tools I use for Power BI with AI. It is fewer than you might think: two tools do the work, and one set of rules keeps the result looking like my reports.
- Claude Code. The command-line agent. Claude Code reads my Power BI model, writes the report files, validates them and takes screenshots of the result in Power BI Desktop.
- The report authoring skill. Microsoft’s free skill for writing Power BI report files, published in the skills-for-fabric repository on GitHub next to the planning and design skills. I extend it with my own references. The skill is public; my references are what I keep for myself.
- HTML mock-ups. Claude Code draws the page as a simple web page from the real model before anything exists in Power BI. Sometimes I use Figma mock-ups instead.
- Brand identity and design rules. My colors, fonts, grid and card sizes, written down once. As a result, the agent follows them on every page.
For the setup details of the skill, read my post on the Power BI report authoring skill and Microsoft’s report authoring skill documentation. To follow along, you also need Power BI Desktop 2.157 or later and Node.js 20 or later for the command-line tools of the skill.
The other Power BI AI skills: planning and design
The report authoring skill is not alone. Microsoft ships it together with a report planning skill and a report design skill in the same Power BI authoring package. I have both installed, but I rarely use them, because I usually know what a page has to answer and how I want it laid out. So in practice, my Claude Code Power BI setup runs almost only on the report authoring skill.
However, the other two can help a lot when you are unsure what data to show or how to lay out a page:
| Skill | What it does | When it helps |
|---|---|---|
| Report planning | First, it runs a guided workflow: define, inspect the model, write a spec, approve, build, validate, publish. It asks one question at a time and locks a report spec you approve before anything is built. | When you start from a model and do not know yet what the report should show. |
| Report design | It inspects the model, then decides tone, page layout, chart types, color, typography and accessibility. Finally, it hands a design brief to the authoring skill, since it does not write report files itself. | When you are unsure how to present the data, or when you restyle a report or apply a brand. |
| Report authoring | It writes and validates the report files, reloads Power BI Desktop and checks screenshots. | For every page. As a result, this is the one I use daily. |
Best AI for Power BI: which model I use
For Claude Code and Power BI, I use the Max plan with Opus 5.5, because it gives me the best results. Sonnet works too. However, I would not use Haiku for this kind of work. On an API key you pay per token, so a cheaper model can make sense there. Other command-line agents also let you pick models from other providers, and some of them use fewer tokens than Opus.
Claude Code vs Power BI Copilot
Many people ask me why I do not just use Power BI Copilot. It is a fair question, since Copilot can create report pages and help with the semantic model. Here is my experience, not a verdict:
| Copilot in Power BI | Command-line agent + skill | |
|---|---|---|
| Where it runs | Inside Power BI | On your computer, in your project folder |
| Design control | Limited, in my experience | Every property in the report files |
| Company approval | Usually part of your Microsoft setup | Needs its own approval |
| Where it works for me | Measures, descriptions, quick questions about the model | Report design, layout and reusable patterns |
In other words, Copilot is fine for semantic modeling, but for report design I get much further with Claude Code and my own Power BI skill. The catch is that external agents run outside Power BI, so your company needs a strategy that allows them. Ask first.
Set up once: PBIP, skill and sample data
A PBIX file is one sealed package. A PBIP project, on the other hand, is a folder of text files, and this one switch is what makes the rest of the Claude Code Power BI workflow possible.
- Turn on the save option. If your version still lists it, go to File > Options and settings > Options > Preview features and enable the Power BI Project (.pbip) save option.
- Save as PBIP. Open your PBIX, then choose File > Save as and pick “Power BI project files (*.pbip)”.
- Look at the folder. You now have a .Report folder for pages and visuals and a .SemanticModel folder for tables and measures. You do not need to understand every file, because the agent reads them for you.
- Start with sample data. Build your first pages on a project without real company data, and check what the AI can see before you go further.
If the three file formats still feel confusing, my post on PBIX vs PBIR vs PBIP explains them side by side.
The reference loop: teach Claude Code your Power BI patterns
This is the part many AI demos skip, and it is where Power BI AI skills get most of their quality. The loop has four steps, and you repeat it every time you find a pattern worth keeping.
Step 1: Find a report you like
The fastest way to teach the agent your taste is to show it reports you admire. I look in three places: public report challenges and competition entries (often with the file to download), YouTube and LinkedIn creators who share their PBIX, and dashboard designs on Dribbble or in the Figma Community. In addition, I keep the designs I like in one Figma file, each with the link to where I found it.
A good reference has one clear pattern, such as a KPI card, a variance chart or a filter panel, not a whole report. It also solves a problem you actually have, and you know where it came from, so you can check that you may reuse it. For layout ideas, my collection of 71 dashboard wireframe examples is a good start.
Step 2 and 3: Save it as PBIP and study one visual
A screenshot shows the look, whereas the file shows how it is built. So when you can get the PBIX, save it as PBIP into a separate references folder, point the agent at it and name the page and the visual you care about. Then ask Claude Code about four things in the Power BI file: layout, formatting, the measures behind it, and where the colors come from.
For example, this is the kind of answer the agent gives about a chart in the example report: the deviation chart is a standard column chart, but its color is not fixed. Instead, it comes from a measure that returns green or red for each month. That last detail is the part worth keeping. I showed this process on a real visual in the video Claude Code Built a Better Power BI Filter Panel Than Me, and the result is written up in my post on the Power BI pop-up filter panel.
Step 4: Teach your skill, text plus a picture
Next, add the pattern to your Power BI report authoring skill as a new reference, so Claude Code can reuse it: a short name, when to use it, the exact settings from the visual file, the measures it needs as generic patterns, and a picture of the result. In my experience, text-only references get messy, because the picture shows the agent what “done” looks like.
Here is why this matters. Out of the box, the skill could not build an IBCS variance chart from native visuals, since that needs many measures working together and there was no example to copy. Once my example was in the skill, it could rebuild the pattern. Consequently, every reference you add makes the next Claude Code Power BI report faster.
The agent knows the basics. It does not know your basics. References are what make a skill yours.
Plan, build, design: from question to Power BI page
Steps 5 to 8 turn one idea into one finished Power BI page with Claude Code. I build one page end to end first, because changing a layout in Power BI takes time while changing it in HTML takes one sentence.
Step 5: Ask four questions before you build
Before Claude Code touches a Power BI layout, I write down the questions the page has to answer. If a visual does not help answer one of them, it does not go on the page.
- How did we perform? The headline number, top left, seen first.
- How good was it? Against plan and against last year.
- Why? What or who caused it: which customer, which product, which month.
- What do we do about it? The biggest gap, and where to act first.
A number without a comparison means nothing.
I go deeper into this structure in Power BI report structure and in the video How to Design Power BI Reports That Drive Action (With Claude). Also, place things in the order the eye already moves: most important KPI top left, KPIs on top, trends in the middle, rankings at the bottom.
Step 6: An HTML mock-up from your real data model
Before I open Power BI, I let Claude Code read the semantic model and draw the page as one HTML file. It uses only fields that exist in the model, and it labels every element with the exact table and measure name. As a result, if something is missing, I see it now and not after an hour of building.
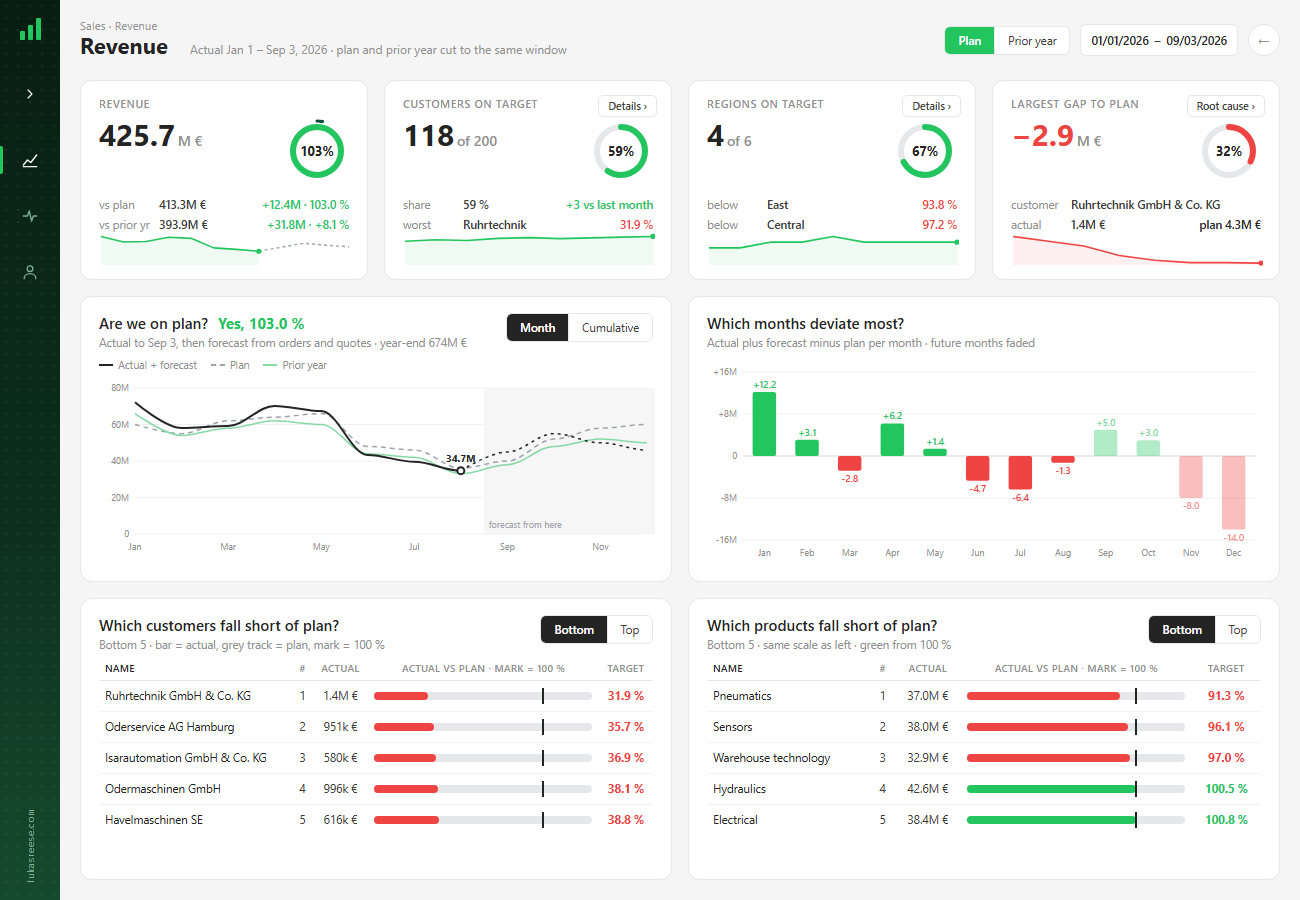
Then I refine the mock-up in plain sentences, for example “move the trend chart to the top left, make the donut a sorted bar chart, keep all field labels”. I change the order and size of cards, chart types, titles as questions, colors, and switches such as Plan or Prior year. Only when the page feels right does Claude Code build it in Power BI.
Step 7: Build in PBIP with Claude Code and the Power BI Desktop Bridge
Now the mock-up becomes a real page, and the field labels tell the agent which field goes into which visual. What helps most is letting Claude Code look at its own result in Power BI:
- First, save your work in Power BI Desktop, because the agent reads the files on disk, not your open window.
- Then run the build with the path to your PBIP and the HTML mock-up.
- Read the missing-fields list, and create those measures yourself or change the mock-up. Never let the agent guess.
- After that, the agent reloads the report through the Desktop Bridge, takes screenshots of the page, checks data, visuals and alignment, and fixes what is wrong. Then again, until it is right.
The Desktop Bridge is a preview feature of Power BI Desktop that lets an agent reload your open report and take screenshots of it. I explain the setup in Power BI Desktop Bridge: how Claude controls Power BI. Expect some trial and error at the start. However, every fix you make is a new reference for your skill, so the next page starts where this one ended.
Step 8: Polish the design
Most design time goes into small decisions made again and again: which grey, how much space, which font size. A design system makes each decision once, and Claude Code then follows it on every Power BI page. My principles are simple: one accent color and everything else grey, green and red only for good and bad, a fixed grid, and two font sizes that matter.
The background carries the cards, borders and side rail, so the visuals on top stay simple. For example, I start from a screenshot of a report I like and let the agent create a matching SVG background, as shown in Power BI background SVG. There is also a Figma connector for Claude, so the agent can build a background directly in Figma. For the grid itself, I built the Power BI Background Designer, and I cover tools, layouts and principles in dashboard design for Power BI.
Before and after: same data, better design with Claude Code
Same model, same numbers. The basic page is what you typically get when you ask an AI for “a revenue report”: default theme and standard visuals. The finished page went through the whole Claude Code Power BI framework. Both pages are in the PBIP file of the free guide.
Three things changed:
- Titles answer questions. For instance, “Which customers fall short of prior year?” instead of a field name. Every title is a measure and changes with the filters.
- Color means something. There is one accent, and green and red only mark above and below the comparison.
- Every number has a comparison. Plan or prior year sits next to each value, with a switch to choose. The switch is a disconnected table read by a measure, similar to the pattern in handling the selected value of a field parameter.
To find your own before and after, let Claude Code review your Power BI page first. It lists the biggest design problems ranked by impact, without changing anything yet. For more layout rules, see my Power BI dashboard design best practices.
Validate, review, ship
The last bar on the poster is the least exciting and the most important one. First, Claude Code validates the Power BI report files. Then a person reviews the page: numbers against the source, fields, layout. Only after that does it ship.
Validation passing is not enough. A person checks every agent-built page before it ships.
If you lead a BI team, add three more things before a second person starts: a shared design system stored in the theme and in a team skill, written standards for naming and approved patterns, and data safety rules agreed with your data protection officer. Otherwise, one person using an agent is a productivity gain, while a team using agents without shared rules is a mess waiting to happen. I wrote more about that risk in why Power BI projects fail.
What Claude Code sees in your Power BI project
A PBIP project is metadata: the definition of your model and report, not the data rows. That sounds safe, and mostly it is. Nevertheless, metadata can still say a lot about your business, and sometimes about people.
| What is in the project | Why it can be sensitive |
|---|---|
| Measures and DAX | Business logic, for example targets, pricing rules or bonus logic. |
| Row-level security (RLS) roles | Filter rules can contain user names, email addresses or client names. |
| Table, column and page names | They can reveal your systems, your clients and their structure. |
| Titles and descriptions | Likewise, client names, project names and internal wording. |
| Connection strings and parameters | Server names, database names and file paths. |
| The local data cache | In contrast, .pbi/cache.abf holds the loaded rows. It stays on your machine and is excluded by the default .gitignore. Do not share it. |
Three questions to ask first
- Where does my data go? Your prompt and the files Claude Code reads from your Power BI project are sent to the AI provider to process.
- Is it stored or used for training? That depends on your tool, your plan and your settings. For Claude Code, check the data usage documentation and your privacy setting.
- Is this tool approved at my company? If you are not sure, the answer is no until someone says yes.
My rule is simple: build with sample data first, and before a real project goes near an AI tool, look at its RLS roles, names and titles once yourself. The guide also lists setups built for company data, such as enterprise AI plans and EU gateways, as options and not as legal advice.
What is inside the free Claude Code Power BI guide
This post is the map for building Power BI with AI. The free guide is the full walk-through, so you can rebuild the example page yourself:
- 25 pages in 6 parts: setup, build your skill, plan and design, mock-up, build, and safety and next steps.
- 7 prompts you can copy: study a visual, teach the skill, create a background, build a mock-up from your model, build the page, add a switch, and review a page like a designer.
- The PBIP file: the Sales Cockpit with two pages, the basic version and the finished revenue page. Sample data only: every company, product and person is invented.
- A worked example in six steps, from opening the file to comparing your page with mine.
Download the guide and the PBIP
Open the finished page next to your own, run the prompts, and compare. Unsubscribe any time; the files stay yours.
How I Build Power BI Reports with AI
Same data, two very different pages. Both built with AI. This is the process behind the second one.
What you get:
- The 25-page guide: my full process, tool stack and 7 prompts you can copy
- The PBIP file with the same revenue page twice: the basic AI output and the finished page
- The process on one page, to print and keep next to your screen
For five more jobs you can hand to an agent, read speed up Power BI report development. In addition, you can follow the build videos on my YouTube channel.